
Bitcoin's Mid-Cycle Ascent: Mapping the Road to New Highs in 2025
Why Technical Structure, On-Chain Signals, and Historical Cycles Point to a Continued Bull Market-and How to Navigate the Volatility Ahead

Date: April 27, 2025
Prepared for Advanced Technical Readers

1. Executive Summary
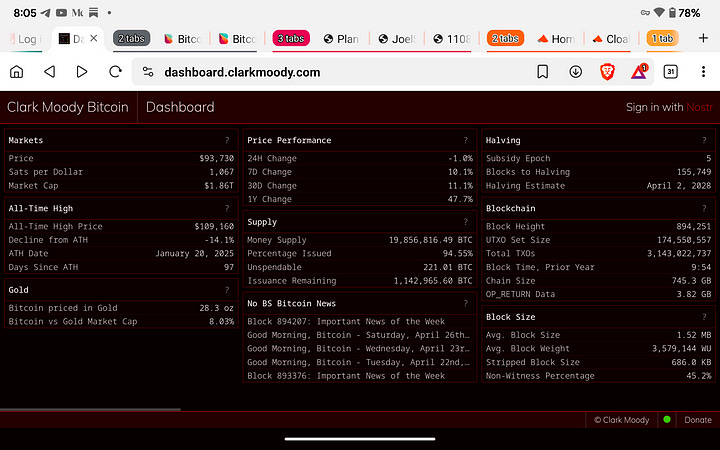
Bitcoin is trading at approximately $93,738, continuing a strong multi-week rebound from the corrective lows witnessed in March 2025. The market is demonstrating classic mid-bull-cycle behavior: strong recoveries following sharp retracements, grinding liquidity up through local resistance levels. Sentiment indicators show a neutral to moderately positive posture, with the Fear & Greed Index at 54, suggesting a cooling of short-term emotions without signaling full market exhaustion. Meanwhile, the CBBI (Crypto Bitcoin Bull Run Index) sits at 72, a historically significant level that has traditionally preceded full euphoric tops by several months.
Despite the pullback earlier this quarter, structural bullish conditions persist across both on-chain and technical indicators. Bitcoin remains firmly within a bullish macro structure, though historical cycles remind us that volatility becomes increasingly frequent and violent as price advances deeper into a bull cycle’s later stages.
2. Bitcoin Price Structure and Technical Outlook
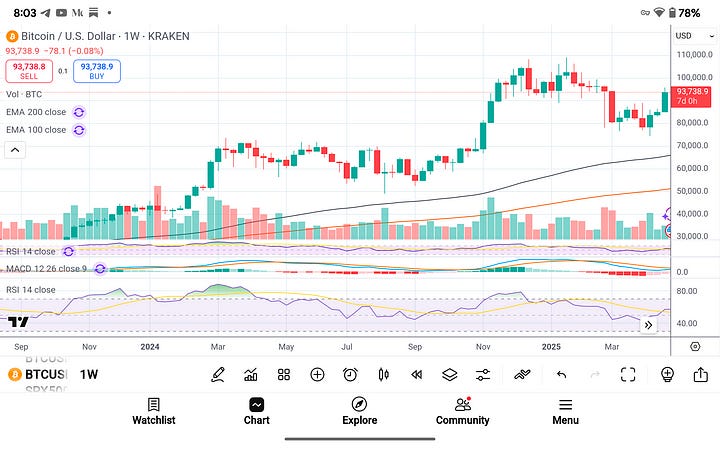
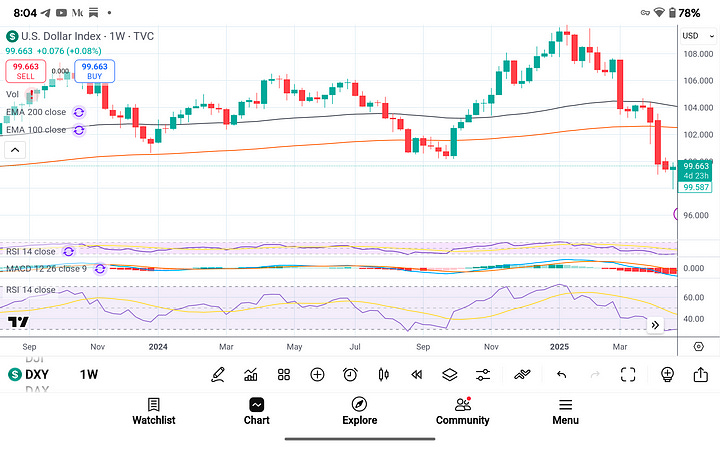
On the weekly timeframe, Bitcoin continues to post a series of higher highs and higher lows, confirming the reestablishment of a macro bullish trend. The breakout from the $82,000–$85,000 consolidation range in late March catalyzed the recent move toward the $95,000 resistance zone.
The 100-week and 200-week exponential moving averages remain firmly beneath price and continue to slope upward, providing a dynamic support bed around the $66,000–$72,000 zones. Historically, Bitcoin has only breached the 200-week EMA during bear market capitulation phases; its current distance from this level further confirms that the market is not in a distribution phase.
Momentum indicators such as the weekly MACD have flipped into bullish territory as of mid-April 2025, with a confirmed cross and expanding histogram. The Relative Strength Index (RSI) on the weekly chart is trending upward near 63, suggesting strong positive momentum while leaving room for further price expansion before conditions become overbought.
From a volume analysis perspective, the uptrend is supported by increasing buy-side volume, while corrective candles are characterized by lighter sell-side volume, a classic bullish signature confirming accumulation rather than distribution.
Should Bitcoin sustain a weekly close above $95,500, a rapid advance toward the psychological $100,000 barrier and ultimately a retest of the $109,000 all-time high becomes increasingly probable.
3. Realized Price, On-Chain Valuations, and Historical Parallels
Analyzing Bitcoin’s Realized Price — a critical cost basis indicator for the network — shows that the spot price is significantly elevated above the realized price line, currently estimated near $39,000 to $40,000. Historically, major bull cycles accelerate only once price remains consistently above realized price for several months, as seen in the 2012–2013, 2016–2017, and 2020–2021 cycles.
Importantly, price slipping below realized price has traditionally marked deep bear market bottoms, not bull market tops. The current configuration confirms that the network is operating in full bull market conditions, supported by rising aggregate profitability.
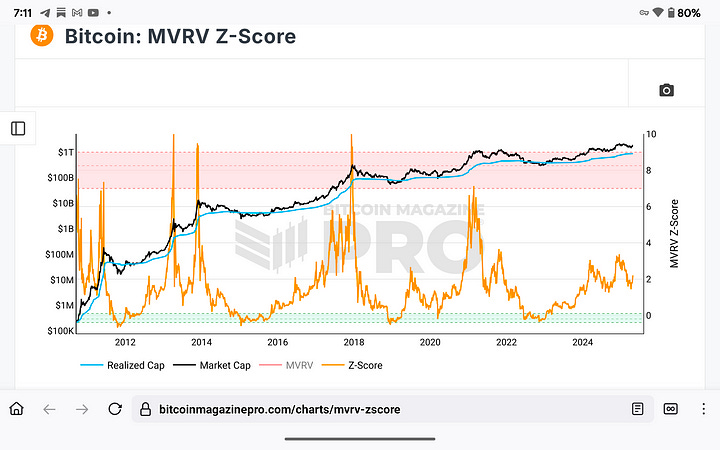
The MVRV Z-Score, which measures how far market price deviates from realized price in standard deviation terms, is approximately at the 3.5 to 4.0 level based on recent readings. In previous cycles, MVRV peaks above 7.0 typically coincided with cycle tops. Therefore, current valuations suggest Bitcoin remains well within safe territory relative to past macro top signals.
The colorization of realized price data by days until the next halving further confirms historical behavior: as Bitcoin approaches 400 to 200 days post-halving, price tends to enter its steepest and final leg upward. Bitcoin is now about 2–3 months past the 2024 halving, lining up precisely with these historical expansion zones.
4. Miner Behavior and the Puell Multiple
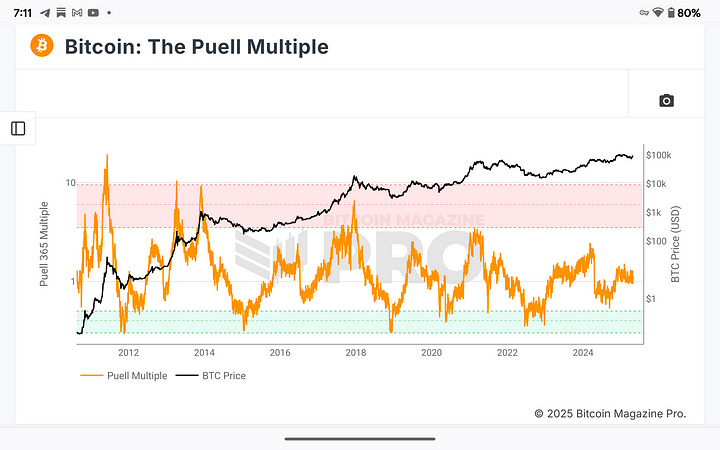
The Puell Multiple, which gauges miner revenue relative to historical norms, remains subdued in the 1.5 to 2.0 range. Peaks in the Puell Multiple above 5.0 have historically marked major market tops as miners aggressively distribute coins into overheated markets, as seen in late 2013, late 2017, and early 2021.
The present low Puell reading implies that miners are not yet experiencing outsized profitability sufficient to incentivize heavy selling. Instead, issuance remains absorbed by the market without overwhelming it, supporting continued price stability and upward trajectory.
This alignment between miner issuance, market absorption, and low Puell readings typically precedes final bull market parabolic expansions, and as such, remains extremely constructive for the medium-term outlook.
5. Sentiment Analysis and Market Psychology
The Fear & Greed Index’s current reading of 54 indicates a state of cautious optimism among market participants. Historically, Bitcoin market tops are preceded by sustained Fear & Greed readings above 90, often for several consecutive weeks. A single spike into “extreme greed” is not sufficient by itself; it is the sustained sentiment euphoria that typically signals final distribution phases.
The Crypto Bitcoin Bull Run Index at 72 mirrors similar historical stages witnessed in mid-2017 and late 2020. In those prior cycles, reaching a CBBI value of 70–75 typically preceded an additional 4–8 months of upward price action before reaching peak cycle conditions.
Taken together, these indicators suggest that while localized corrections and sharp pullbacks are possible at any time, the broader market structure remains incomplete in terms of final cycle progression.
6. Historical Cycle Comparison and Current Status
Drawing parallels from prior Bitcoin cycles, the current macro structure shares more characteristics with the mid-phase accelerations seen in late 2016 and late 2020. In both prior instances, Bitcoin saw sustained rallies over a 6–9 month period following the halving, with prices pushing beyond previous all-time highs before reaching final parabolic advances.
Current realized price behavior, Puell Multiple position, MVRV Z-Score levels, and sentiment indicators all align with a mid-phase bull market configuration. None of the historically reliable macro top signals are yet fully triggered, although cautionary vigilance becomes increasingly important as valuations climb.
Thus, from a historical perspective, Bitcoin is likely in the second-to-last leg of its current bull market cycle. A retest and breakthrough of the previous ATH at $109,000 would likely catalyze a rapid advance toward new price discovery levels in the $118,000 to $135,000 range, with even $150,000 targets achievable under aggressive speculative conditions.
7. Risk Management and Forward Strategic Outlook
While the technical and macro-structural case for continued upside remains strong, volatility is expected to increase significantly as Bitcoin nears psychological and technical resistance zones above $100,000.
Pullbacks of 15–20% are typical even within the strongest bull markets, and such movements should be anticipated rather than feared. Historically, Bitcoin experiences multiple steep corrections within its final ascent phases before cycle tops are realized.
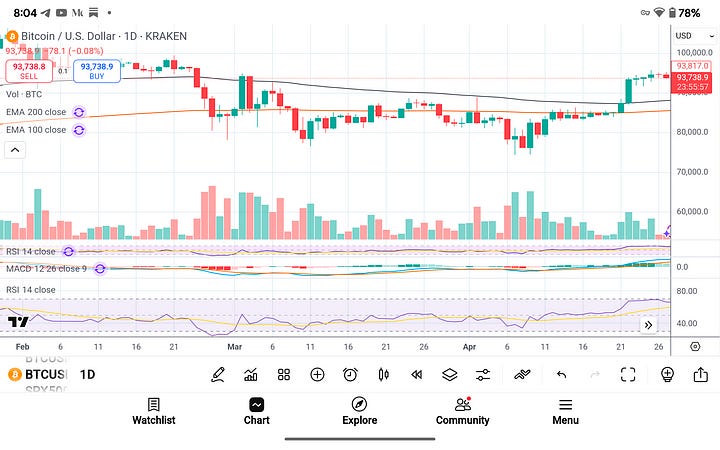
Key technical and psychological thresholds to monitor include the $95,500 daily and weekly closing levels, the $99,000–$102,000 resistance cluster, and the all-time high retest at $109,000. Failure to maintain support above $88,000 on weekly closes would represent an early warning signal for deeper retracement scenarios.
Risk management should continue emphasizing staggered profit-taking strategies on strength, tactical accumulation on weakness, and careful monitoring of sentiment metrics for signs of overheating.
Conclusion
Bitcoin remains firmly in a bullish macro structure, supported by technical momentum, on-chain valuation dynamics, historical cycle parallels, and moderately positive but non-euphoric sentiment.
The next six months present a high probability window for Bitcoin to challenge and surpass its prior all-time highs, with potential targets extending toward $135,000 and $150,000 under favorable conditions. However, as the cycle matures, caution, risk management, and psychological resilience become increasingly critical to successfully navigate the volatility that defines Bitcoin’s terminal bull market phases.
The technical roadmap is clear: sustained closes above $95,500 and especially $100,000 would open the pathway toward final cycle blow-off dynamics. Until then, disciplined observation, strategic positioning, and emotional control remain the key ingredients for success.
You can sign up to receive emails each time I publish.
Link to the original Bitcoin White Paper: White Paper:
Dollar-Cost-Average Bitcoin ($10 Free Bitcoin): DCA-SWAN
Access to our high-net-worth Bitcoin investor technical services is available now: cccCloud
“This content is intended solely for informational use. It is not a substitute for professional financial or legal counsel. Accuracy of the information is not guaranteed; therefore, it is advisable to consult with a qualified financial advisor before making any substantial financial commitments.”