
Bitcoin Spring-Loaded: The Volatility Coil Tightens as Macro and On-Chain Fuel a Blow-Off Top
Liquidity returns, supply vanishes, and Bitcoin eyes escape velocity heading into Q3-Q4 2025

Bitcoin Spring-Loaded: The Volatility Coil Tightens as Macro and On-Chain Fuel a Blow-Off Top
Liquidity returns, supply vanishes, and Bitcoin eyes escape velocity heading into Q3-Q4 2025
Bitcoin remains coiled beneath the surface like a compressed spring, consolidating within a structurally bullish regime while sentiment misreads the signals. On the surface, the recent $105K price level appears stagnant, but under the hood, Bitcoin is quietly transitioning from a mid-cycle reaccumulation into the beginnings of an explosive parabolic phase. Technically, on-chain data, macro liquidity, and derivative positioning point to a market that’s structurally primed — not exhausted.
Let’s break it all down.
I. Technical Structure: Weekly Resolution Points to Bullish Continuation
The weekly chart shows Bitcoin firmly holding above both the 20-week and 50-week EMAs, with the 20 EMA acting as dynamic support since Q1 2024. We’ve seen a brief mid-cycle pullback from the $108K level, but structure remains intact — no lower low has been printed, and RSI is resetting from overheated territory while staying above the 50 neutral zone.
MACD histogram on the weekly is gradually flipping green, showing momentum building again after a healthy period of consolidation. Volume remains steady, and we’re not seeing the classic exhaustion volume spikes that signal a macro top. Rather, this is the type of calm base-building structure Bitcoin often forms before vertical expansion.
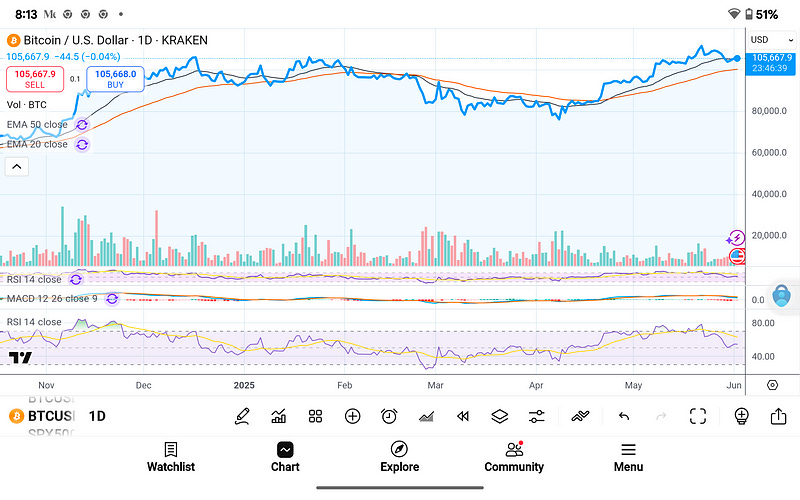
On the daily chart, the 20 EMA has reasserted itself as support after a brief deviation. Price has reclaimed and is hovering right around the 105K mark, consolidating just beneath the recent local high. RSI is cooling, and MACD lines are tightening, preparing to curl upward. In short — Bitcoin is charging up.
II. M2 Money Stock, DXY, and Macro Liquidity Alignment
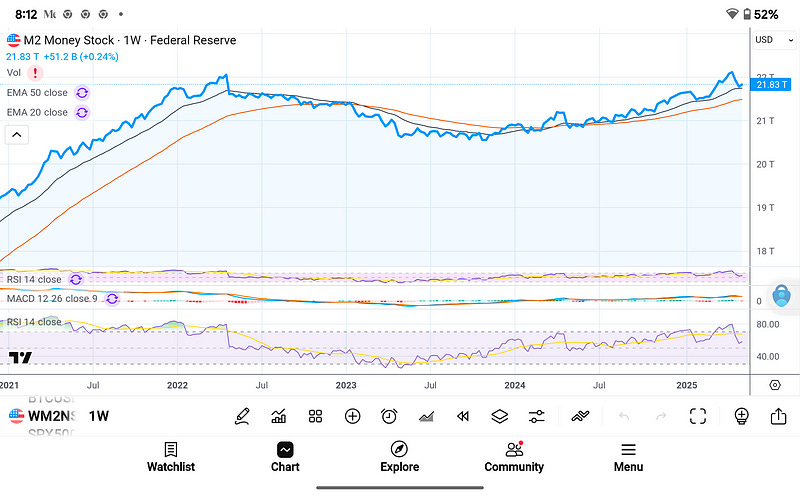
The macro liquidity backdrop continues to quietly improve, even as traditional media narratives remain focused on “tight financial conditions.” The M2 money stock — a proxy for broad USD liquidity — has resumed its upward trajectory, crossing $21.83T. This slow but persistent expansion of base money provides indirect fuel for all risk assets, but Bitcoin uniquely benefits given its fixed supply nature.
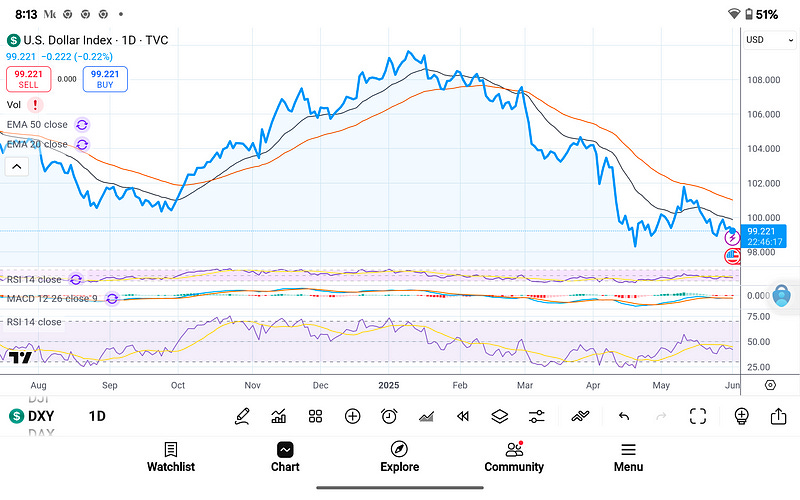
Conversely, the U.S. Dollar Index (DXY) has rolled over hard. Currently trading under 99.3, it’s forming a rounded top breakdown structure on both the weekly and daily charts. This suggests an inflow rotation out of dollars and into stores of value. Historically, a weakening DXY alongside an expanding M2 is one of the most potent macro backdrops for Bitcoin upside — a dynamic last seen in early 2020 before the explosive $10K → $69K move.
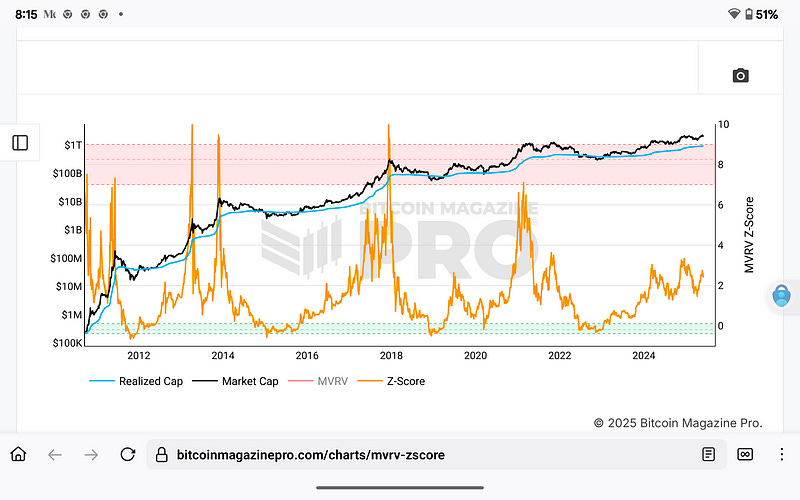
III. On-Chain Health: MVRV Z-Score, Puell, Realized Price All Flash Mid-Cycle
Bitcoin’s on-chain metrics confirm we are not in blow-off top territory — not even close.
MVRV Z-Score remains in the mid-zone (3–4), far below the red overheated zone (>7) where previous cycle tops form. This tells us the market cap relative to realized cap is not euphoric; there is significant room to run.
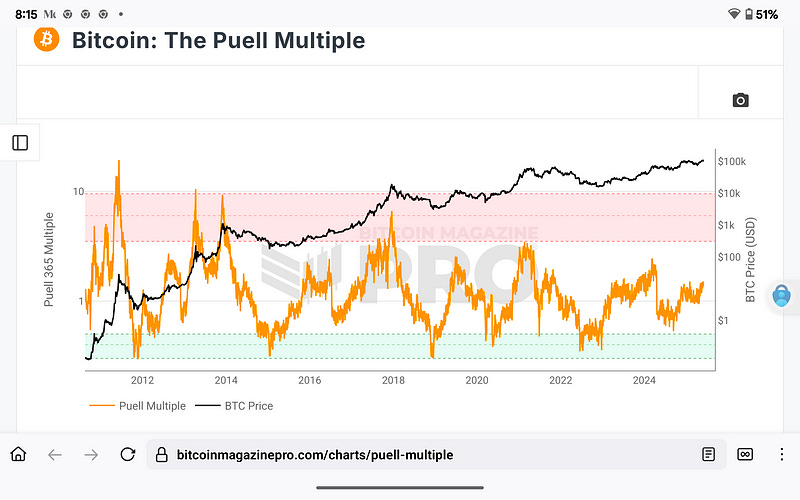
The Puell Multiple — a key measure of miner profitability — is comfortably within neutral bounds. Miners are not yet incentivized to sell aggressively, and historical tops only appear when this metric exceeds 6–10. We’re in the 2–3 zone.
Realized Price vs Market Price continues to show strong divergence upward, but not a blow-off gap. When market price trades at 3x–5x the realized price, we approach danger zones — currently, we’re under that band.
The on-chain takeaway? Bitcoin is not overheated, and based on past cycles, this is likely the pre-euphoria expansion — not the end.
IV. Sentiment: CBBI and Fear & Greed Reset
The CBBI (ColinTalksCrypto Bull Run Index) reads 77, implying we’re in the mid-to-late bull phase, but still shy of euphoria. Historically, 90–100 prints mark peaks. This aligns with our broader thesis: we’re approaching the acceleration zone, but haven’t yet entered mania.
Meanwhile, the Fear & Greed Index has softened to 64, cooling from the 70s despite price near ATH levels. This divergence is a gift — bulls often want to see fear and apathy at high prices, which is exactly what we’re getting.
V. Derivatives and Supply: Coiled Liquidity and Shrinking Exchange Balances
Futures open interest remains elevated, but not excessively leveraged. Funding rates are neutral to slightly positive, suggesting long positioning is healthy but not yet overcrowded. This eliminates the risk of a mass long liquidation and actually supports further upside.
More critically, exchange BTC balances are at a 5-year low. Long-term holders remain strong, with over 70% of supply unmoved in 12+ months. Glassnode’s illiquid supply metric shows ongoing accumulation — not distribution.
The setup here is textbook bullish: limited supply, increasing demand, and liquidity returning.
VI. Bull Market Structure: Supercycle Thesis in Play
We’re not just repeating the 2017 or 2021 cycles. Bitcoin’s current behavior suggests something larger — potentially the first institutionalized supercycle. The presence of spot ETFs, sovereign mining adoption, increasing macro correlation (with decreasing beta to tech), and evolving regulatory clarity suggests that Bitcoin is maturing into a globally adopted monetary asset.
Unlike prior cycles that ended in manic blow-offs followed by brutal 80% drawdowns, this one is showing signs of wave extension. Price compression between peaks and valleys is decreasing. Volatility is dampening. Distribution tops are flattening — not spiking.
This points toward the possibility of a parabolic advance followed by high-level consolidation, not a crash.

VII. Price Projections and Timeline Outlook
Based on current technicals, macro alignment, and on-chain indicators, I remain firmly bullish and expect Bitcoin to enter an explosive expansion phase beginning in Q3 2025. The projections are as follows:
$140,000 — June 2025
$195,000 — Halloween 2025
$265,000 — Christmas 2025
$340,000 — June 2026
$465,000 — Christmas 2026
These targets align with historical extensions, adjusted for ETF-driven demand, and assume continued global fiat debasement, increasing institutional allocation, and persistent illiquidity on exchanges.

VIII. Conclusion: Calm Before the Ignition
Bitcoin is in a rare technical and macro alignment window — the kind that only happens once every few years. We’re not at the top. We’re in the final consolidation zone before the blow-off.
Expect sideways price action to fade in Q3, replaced by volatility expansion to the upside. As liquidity returns, the USD weakens, and ETF flows accelerate, Bitcoin is poised to go parabolic.
We are not in mania yet. But that door is slowly creaking open.
Make no mistake: Bitcoin is spring-loaded — and once it launches, there won’t be time to chase.
You can sign up to receive emails each time I publish.
Link to the original Bitcoin White Paper: White Paper:
Dollar-Cost-Average Bitcoin ($10 Free Bitcoin): DCA-SWAN
Access to our high-net-worth Bitcoin investor technical services is available now: cccCloud
“This content is intended solely for informational use. It is not a substitute for professional financial or legal counsel. We cannot guarantee the accuracy of the information, so we recommend consulting a qualified financial advisor before making any substantial financial commitments.