
Bitcoin Market Update: Consolidation at $95K, Volume Decline, and Key Levels for the Next Move
Bitcoin's current price action between $94K and $100K represents a high-stakes consolidation phase


Introduction: Bitcoin in a Critical Holding Pattern
Bitcoin’s current price action between $94K and $100K represents a high-stakes consolidation phase, where both buyers and sellers are competing for control. The weekly and daily charts reveal that Bitcoin remains in a structural uptrend, but momentum has slowed, leading to lower volatility and declining trading volume.
This phase follows Bitcoin’s parabolic rally from $45K to over $105K, a move that mirrors past cycles, where an initial post-halving breakout led to a consolidation period before further expansion. However, ETF-driven demand, institutional accumulation, and macroeconomic conditions suggest that this cycle may not yet be over, and a push toward $150K–$180K remains in play.
This report provides a comprehensive technical and on-chain analysis, covering:
Bitcoin’s current price action and volume trends
How this cycle compares to past cycles and why it is different
Institutional accumulation and ETF-driven supply constraints
Macroeconomic and regulatory influences on Bitcoin’s next move
Key price levels for the next breakout or correction
1. Technical Analysis: Bitcoin’s Price Action and Volume Decline
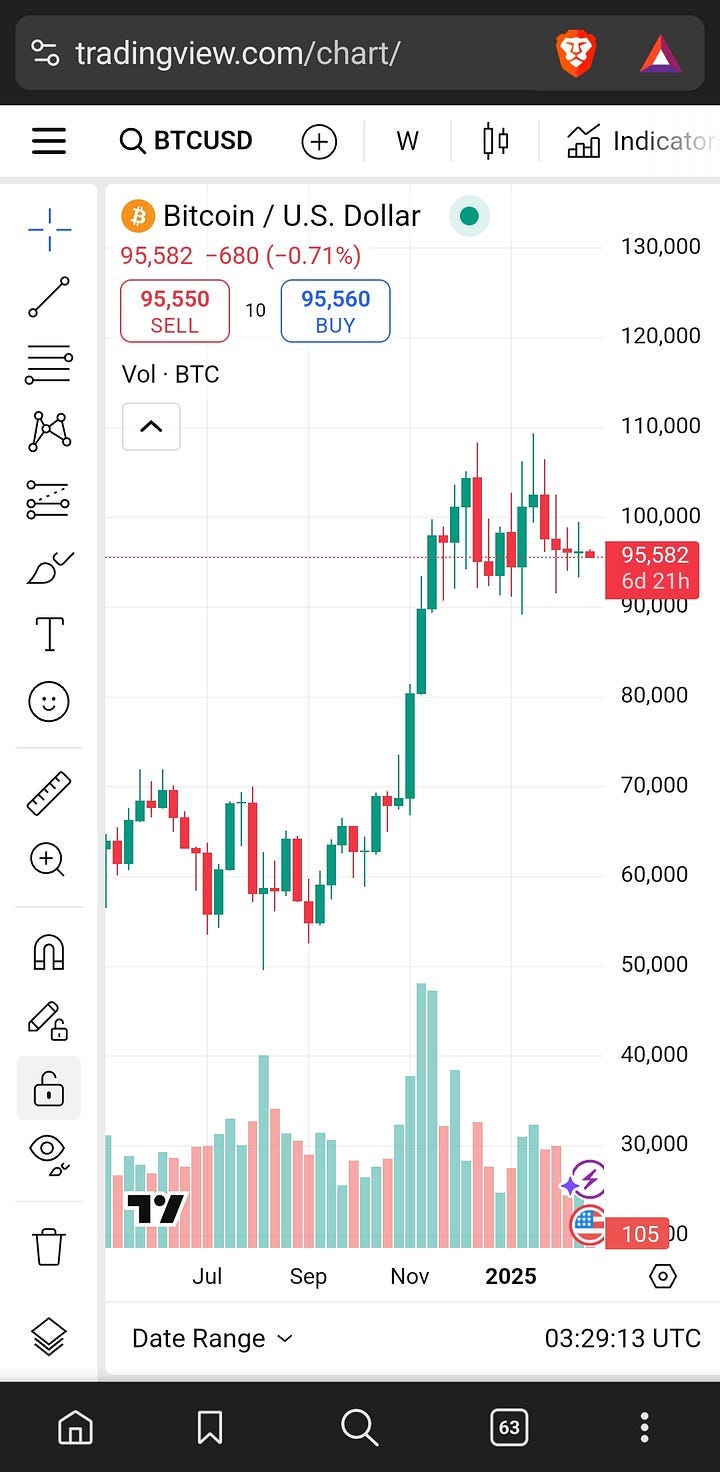
Weekly Chart Overview
The weekly timeframe confirms that Bitcoin is maintaining its uptrend, but momentum has weakened, as seen in the smaller-bodied candles and lower trading volume.
Key Observations on the Weekly Chart:
Bitcoin remains above key moving averages, confirming the broader uptrend.
Price action suggests a consolidation phase rather than a full reversal.
Volume has significantly declined since the ATH attempt at $105K, signaling reduced trading activity and potential liquidity compression.
The current price range ($94K–$100K) aligns with a typical reaccumulation zone before the next move.
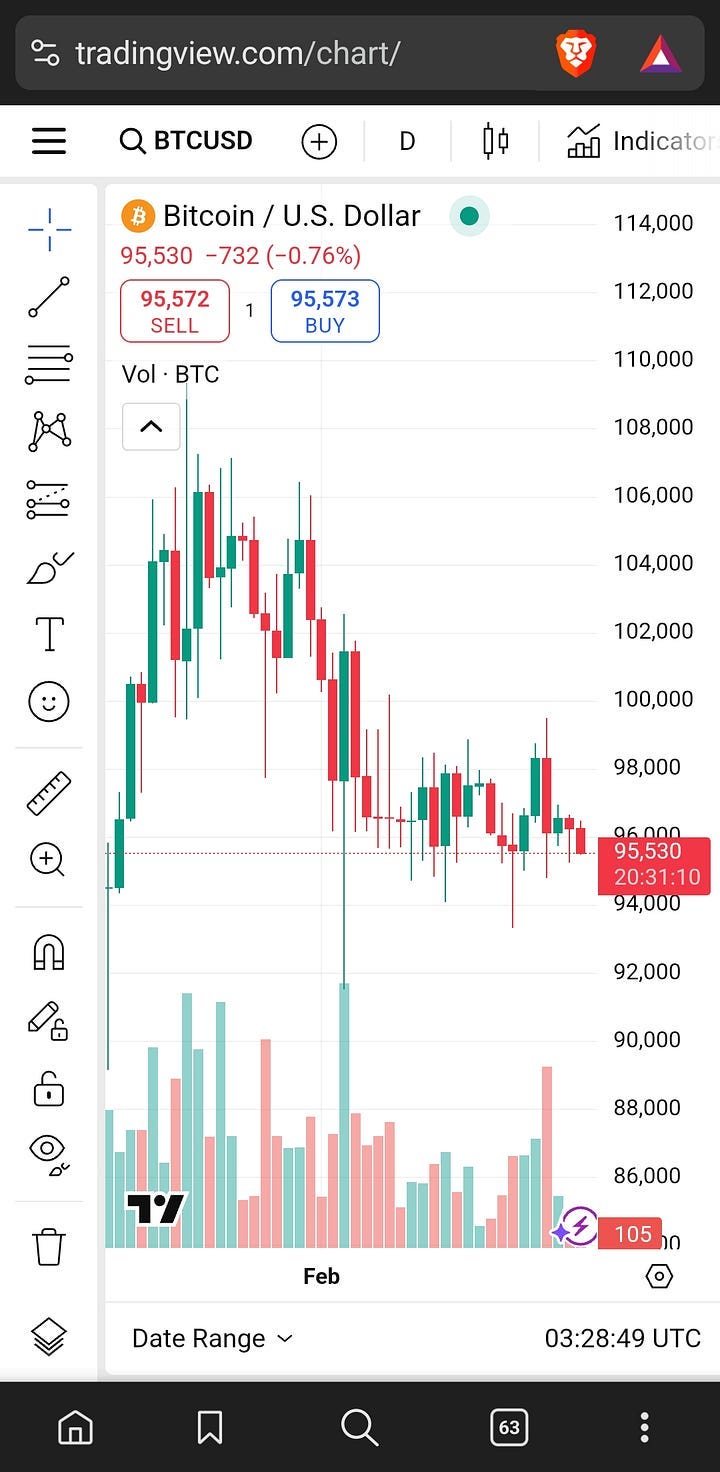
Daily Chart Overview
On the daily timeframe, Bitcoin is trading between $94K and $100K, with lower highs forming, indicating a neutral-to-slightly-bearish structure in the short term.
Key Observations on the Daily Chart:
Bitcoin continues to respect the $95K support level, but multiple rejections at $100K indicate strong resistance.
Volume has been declining, which suggests that market participants are waiting for a directional breakout.
Buyers continue to defend the $94K–$95K range, preventing a deeper correction.
The failure to reclaim $100K increases the probability of a retest toward lower support levels.
Key Technical Levels to Watch:
Support Levels:
$95,000–$96,000: Short-term support—losing this level could trigger a move toward $92K.
$92,500 (Short-Term Holder Cost Basis): Critical support—historically, breaking this level leads to increased volatility.
$89K–$90K: Next major liquidity zone where strong buy orders are expected.
Resistance Levels:
$100,000: Psychological resistance—Bitcoin needs to break above this level to shift momentum.
$105,000: Key resistance from the previous ATH attempt—must be reclaimed for bullish continuation.
$110,000–$120,000: Next breakout target if Bitcoin reclaims ATH levels.

2. How This Cycle Compares to 2016–2019 and 2020–2021
Bitcoin’s current price structure closely resembles the mid-cycle consolidations seen in 2016–2019 and 2020–2021.
Key Similarities with the 2016–2019 Cycle
Bitcoin experienced a parabolic rally, followed by a failed breakout at the ATH and a consolidation period.
Similar to today, post-halving cycles often have a cooling-off phase before the next expansion.
Capital rotation from speculative assets (altcoins, memecoins) into Bitcoin is occurring, mirroring late 2017.
Key Differences That Could Lead to a Higher Peak in 2025
Spot ETFs now provide a structural bid that did not exist in previous cycles.
Bitcoin’s circulating supply is increasingly constrained, reducing potential sell pressure.
Macroeconomic conditions, including potential rate cuts and inflationary pressures, could accelerate institutional adoption.

3. Institutional Accumulation and ETF Demand: A Structural Shift
Unlike past cycles, institutional demand through Bitcoin ETFs has fundamentally changed Bitcoin’s supply dynamics.
ETF Market Impact
Bitcoin ETFs hold over 1 million BTC, significantly reducing liquid supply.
Even on days of price retracements, ETF inflows remain strong, reinforcing demand.
Corporate treasuries and asset managers continue to add Bitcoin as a long-term investment.
How ETFs Are Extending the Cycle
In previous cycles, Bitcoin price action was driven by retail speculation, leading to sharp rallies and deep corrections.
With ETFs, Bitcoin now has consistent institutional demand, reducing the likelihood of a sudden crash.
If ETF accumulation continues, Bitcoin could follow a gold-like post-ETF trajectory, extending the bull cycle into late 2025.

4. Macroeconomic and Regulatory Factors Supporting Bitcoin
Macroeconomic Trends
Inflation concerns remain a dominant narrative—higher-than-expected inflation could impact risk assets, including Bitcoin.
The Federal Reserve’s potential interest rate cuts in 2025 could serve as a bullish catalyst for Bitcoin.
Bitcoin’s correlation with traditional markets remains fluid, but long-term investors view it as a hedge against fiat debasement.
Regulatory Developments
The Trump administration’s stance on crypto is viewed as market-friendly, which could boost institutional confidence.
More companies adding Bitcoin to their balance sheets signals mainstream corporate adoption.
If regulatory clarity improves, Bitcoin’s price could benefit from increased traditional finance participation.

5. Price Projection: Path to $150K–$180K in 2025
Bitcoin remains structurally bullish, with on-chain data confirming continued demand and supply constraints.
Factors Supporting a $150K–$180K Target
Bitcoin’s realized cap continues to increase, suggesting long-term accumulation is ongoing.
Short-term holder (STH) supply remains below 2021 peak levels, meaning the market has not yet reached euphoria.
ETF-driven demand could create a supply shock, pushing Bitcoin into price discovery beyond $105K.
If Bitcoin successfully reclaims $100K–$105K and enters price discovery, the next logical target would be $150K–$180K, assuming continued institutional accumulation and macroeconomic support.

Conclusion: Bitcoin’s Bull Market Remains Intact
Bitcoin’s Consolidation Is a Mid-Cycle Pause, Not a Reversal
Price action between $94K and $100K suggests reaccumulation, not bearish exhaustion.
Volume decline is normal in consolidation phases and often precedes the next breakout.
ETF demand is providing a price floor, reducing the probability of deep corrections.
The Path to ATHs Remains Open
A break above $100K would confirm renewed upside momentum.
ETF-driven supply reduction supports long-term price appreciation.
If macro conditions align, Bitcoin could reach $150K–$180K in late 2025.
Final Thought: The Cycle Is Still Playing Out
Unlike past cycles, institutional demand, ETF supply constraints, and macroeconomic conditions are extending Bitcoin’s growth trajectory. Bitcoin remains well-positioned for new all-time highs, with $150K–$180K as a reasonable late-cycle target.
You can sign up to receive emails each time I publish.
Link to the original Bitcoin White Paper: White Paper:
Dollar-Cost-Average Bitcoin ($10 Free Bitcoin): DCA-SWAN
Access to our high-net-worth Bitcoin investor technical services is available now: cccCloud
“This content is intended solely for informational use. It is not a substitute for professional financial or legal counsel. Accuracy of the information is not guaranteed; therefore, it is advisable to consult with a qualified financial advisor before making any substantial financial commitments.”