
Bitcoin Market Intelligence Report—Week Ending June 15, 2025
Author: Michael P. Di Fulvio, CBSA, CBSP


Market Sentiment Metrics
CBBI Confidence: 75
Fear & Greed Index: 63 (Greed territory)
BTC/USD Price (Weekly Close Reference): ~$105,200 (Coinbase)
1. Technical Analysis—Price Action and Market Structure
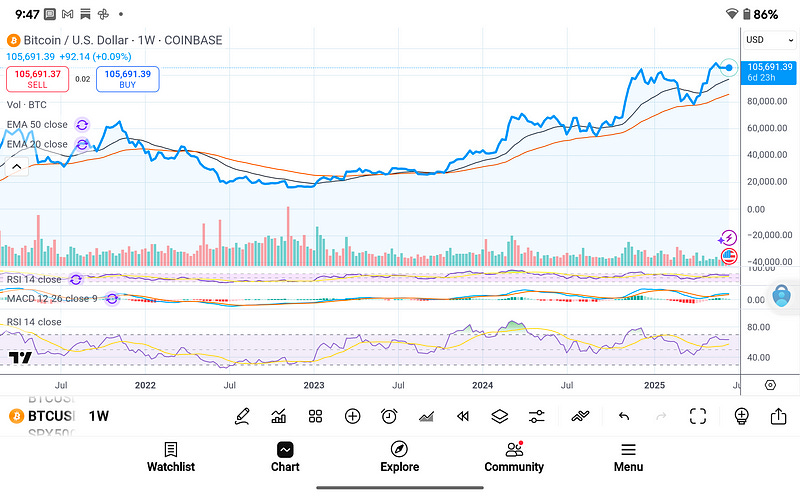
BTC/USD Weekly Chart Analysis
Referencing both Kraken and Coinbase weekly candles, Bitcoin remains firmly within a macro bullish structure. Price continues to trade well above both the 20-week (black) and 50-week (orange) EMAs, with the 20-week EMA currently acting as primary dynamic support (~$90,000 zone). The weekly RSI is comfortably above 60, showing healthy strength but not yet euphoria.
The MACD on the weekly timeframe remains positive and is widening again, following a mid-cycle contraction earlier in Q2 2025. This means that positive market energy is coming back after a period of stability, similar to what happened after previous halvings in 2013, 2017, and 2021.
Key Observation: Bitcoin is exhibiting a “higher high, higher low” trend structure, with strong buyer interest stepping in near the $100k psychological level.
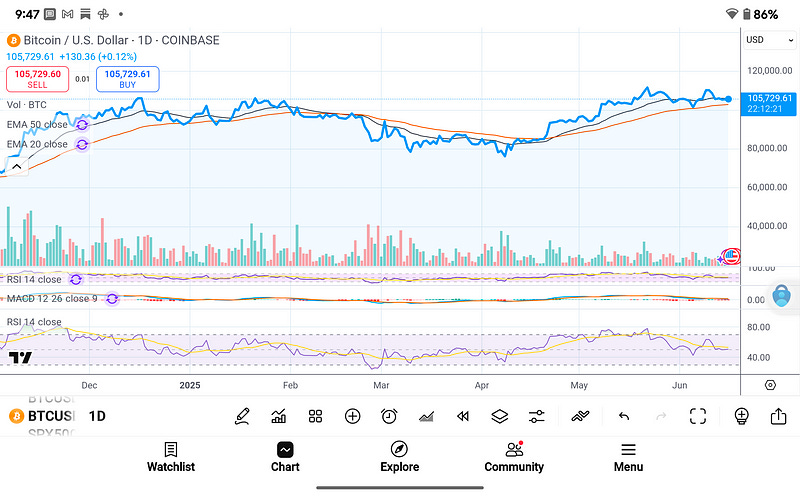
BTC/USD Daily Chart Analysis
The daily chart confirms a period of volatility compression, with price trading sideways between ~$102,000 and ~$106,000 over the past 10 days. RSI is resetting near 50–55 levels, indicating that momentum has cooled short-term but remains structurally bullish. Volume has been declining, signaling potential for a volatility expansion event ahead.
EMA Support:
20-day EMA: ~$104,000
50-day EMA: ~$101,500
Price remains comfortably above both EMAs, forming a bullish continuation pattern.
The MACD shows a flatter histogram, but there has not been a bear cross yet; this suggests that momentum may be pausing before resuming an upward trend.
2. Macro Environment—M2 & DXY Divergence Signals
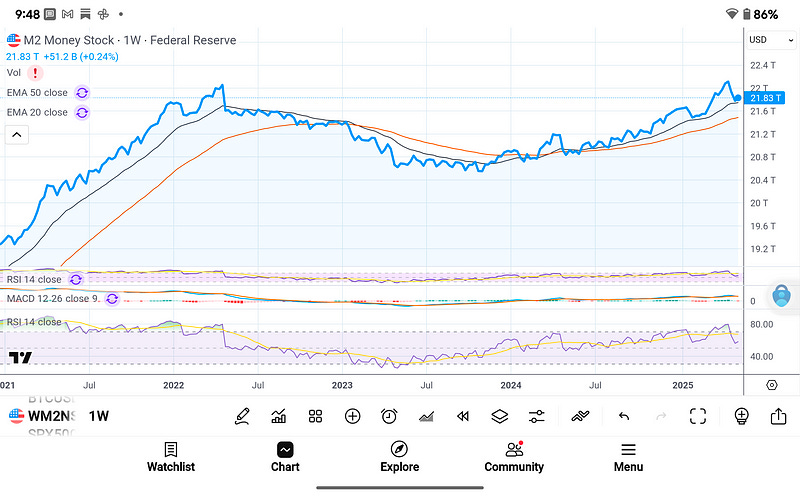
M2 Money Supply (WM2NS)
The M2 money supply sits at $21.83T, exhibiting a resumed expansionary trend after its prior contraction phase in 2022–2023. The 20- and 50-week EMAs have turned up, showing rising liquidity conditions once again—a critical tailwind for risk assets and hard money hedges like Bitcoin.
This finding is historically significant: during past bull cycles, especially in 2020–2021, aggressive M2 expansion correlated with parabolic Bitcoin moves. The macro tailwind is rebuilding.
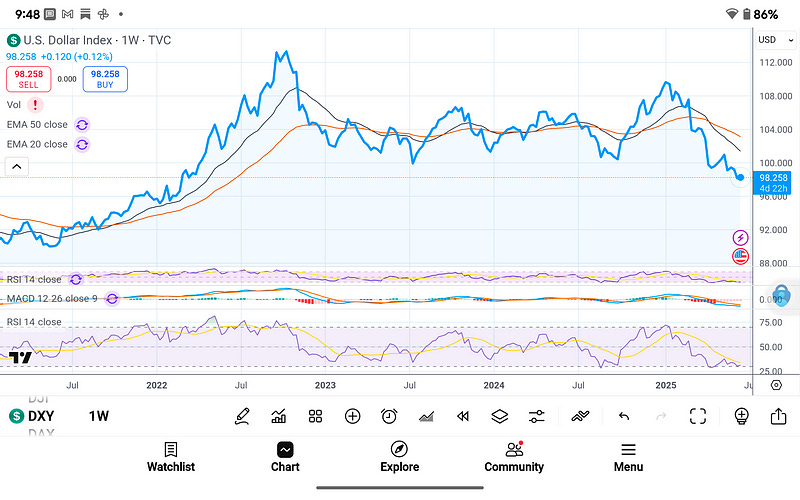
U.S. Dollar Index (DXY)
DXY has broken below the 100 level, with the current price at 98.13. It’s trading beneath both 20-week and 50-week EMAs, continuing a long-term downtrend that started in late 2023. The RSI has fallen into bearish territory (below 40), and the MACD indicator shows accelerating downside momentum.
The current trend is critically bullish for Bitcoin, as a weakening dollar historically correlates with strength in BTC, commodities, and other alternative stores of value.
Conclusion on Macro Correlation: Rising M2 and falling DXY present a Goldilocks zone for Bitcoin’s price expansion.
3. On-Chain Analytics—Fundamental Valuation Models
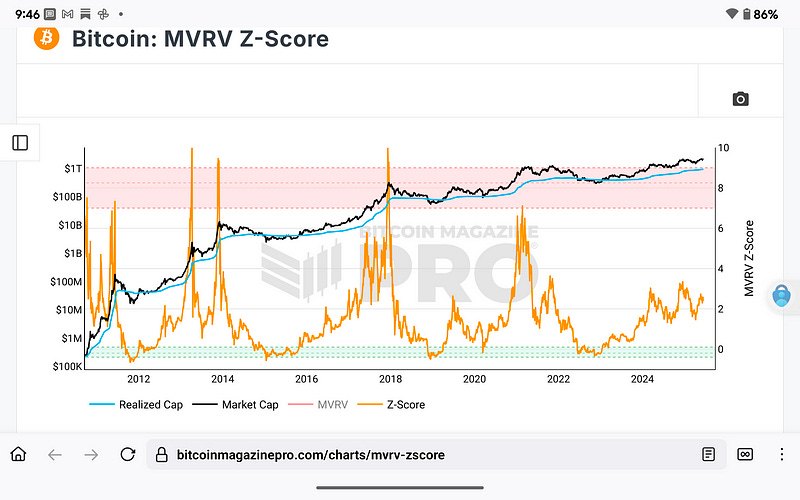
MVRV Z-Score
As of this week, the MVRV Z-Score sits between 2.5 and 2.5–3.0, well below the historical red zone (7–10) that often precedes major cycle tops. This suggests Bitcoin is not overvalued on a long-term basis.
Historically, Z-score values in this mid-range signal the early-to-mid stage of a parabolic leg, as observed in 2013 and 2017. The realized cap fundamentally supports the elevated market cap.
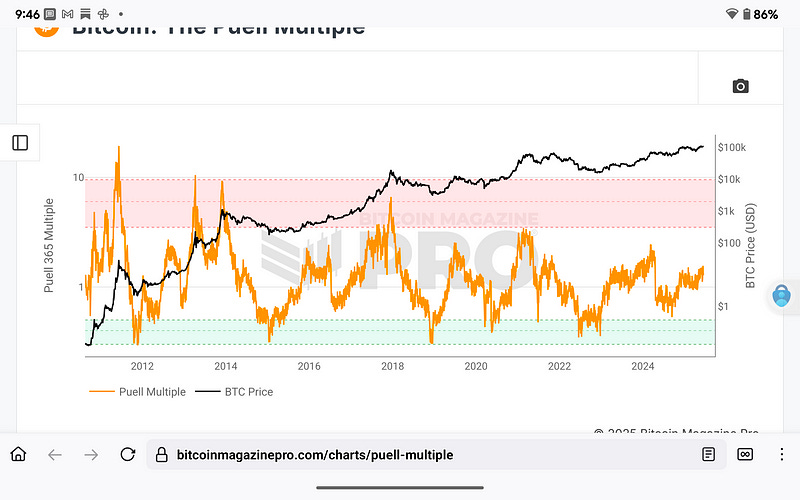
Puell Multiple
The Puell Multiple, which tracks miner revenue over a 365-day average, is currently in a neutral-to-bullish range (~1.8–2.0). This scenario implies miner sell pressure is minimal, and hash price remains sustainable. This environment supports continued accumulation and supply tightening.
Notably, the Puell Multiple has not entered the historically dangerous red zone (>4.0), signaling we are still well below euphoric overheating.
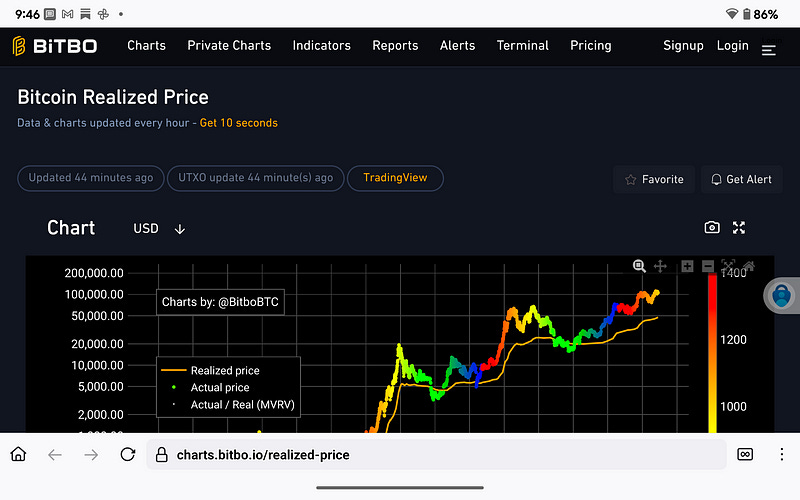
Realized Price vs. Market Price (Bitbo.io)
Bitcoin’s market price continues to hover above the realized price (currently ~$42,000), with a realized multiple around 2.5. While the current level reflects a healthy premium, it’s far below historical bubble tops, which tend to peak between 5 and 5–8x realized value.
Additionally, color-coded trajectory suggests we are entering a “red-orange” pre-euphoria phase—the same stage seen in Q3 of 2013 and Q1 of 2017 before their final parabolic blow-offs.
4. Sentiment—CBBI & Fear/Greed Index
CBBI Index (Colin Talks Crypto): 75
This reading suggests that Bitcoin is in the early acceleration phase of the cycle’s final run. CBBI usually peaks above 90 during cycle tops.Fear & Greed Index: 63
Although the Fear & Greed Index indicates "Greed" territory, it has not yet reached an excessive level. Historically, levels >80–90 mark retail euphoria and signal caution. The current sentiment reflects growing optimism but not irrational exuberance.
5. Final Outlook & Bullish Expectations for Q3/Q4 2025
Historical Context
All major Bitcoin cycles in the past have shown sharp price increases in the third and fourth quarters after a halving, fueled by a mix of more money in the market, solid technical setups, and growing excitement among investors. This current cycle mirrors those dynamics, but now with added institutional flows, ETF infrastructure, and macro tailwinds.
Expectations
Technical Momentum: Resuming from consolidation
Macro Tailwinds: Rising M2 + falling DXY = powerful setup
On-Chain Metrics: Still far from peak danger zones
Sentiment: Bullish, not euphoric
Cycle Timing: Historically aligned with parabolic breakout windows
Projection: We anticipate a parabolic continuation of Bitcoin in Q3 and Q4, potentially surpassing the $150k+ ATH before the cycle top. Structural support zones near $90–95k may serve as final retests before liftoff.
📈 Forward Outlook: Probabilistic Price Targets for 2025
As we synthesize this week’s full-spectrum analysis of on-chain metrics (MVRV Z-Score, Puell Multiple, Realized Price Bands), macroeconomic indicators (DXY, M2 Money Stock), and Bitcoin’s recent price structure across daily and weekly timeframes, the forward outlook for Bitcoin’s price action remains structurally bullish.
The combination of solid support for Bitcoin's price around $85K, a weakening dollar below the important 100 DXY level, and ongoing growth in the money supply shows strong potential for the next price increase. Meanwhile, elevated but non-parabolic levels in MVRV and Puell Multiples suggest that the market has not yet entered euphoric territory—providing headroom for continued upward repricing.
With these dynamics in mind, we are updating our Bitcoin price forecast as follows:
🎯 Updated Bitcoin Price Projections (2025)
$120,000—Start of Q3 (July 2025):
Technical compression combined with seasonal liquidity flows and an increasingly dovish macro tone should catalyze a breakout from the current$105K-$110K range. A breakout above prior resistance zones ($114K) could trigger algorithmic momentum and ETF re-accumulation events.$165,000—Early Q4 (Halloween 2025):
Historically, Bitcoin performs strongly into Q4 following a strong Q3. At this point, late investments from big institutions, stories about countries buying Bitcoin, and increased interest from regular investors could all come together to speed up the rapid price increase—especially as the limited supply from the April halving becomes even tighter.$225,000—Christmas 2025:
We project the apex of this bull market cycle to align with classic blow-off dynamics. Expect maximum media attention, rising volatility, and exuberance near year-end. This phase will likely be marked by steep RSI divergences, extreme greed index readings, and high miner profitability—potentially forming the macro top.
These price levels are not offered as guarantees but rather as probability-weighted targets based on technical fractals, on-chain valuations, and macro regime modeling. Barring geopolitical black swans or systemic liquidity shocks, this trajectory aligns closely with prior cycle expansions post-halving and current data modeling.
Bitcoin continues to operate as a monetizing asset in an era of fiat debasement, and the long-term thesis remains intact: finite supply, infinite demand curve slope.
Closing Remarks
Bitcoin remains the apex monetary asset in an environment where fiat is once again expanding, real yields are compressing, and global trust in traditional financial systems is eroding. All technical, macro, and on-chain indicators currently align to suggest that Bitcoin’s next exponential phase is imminent.
Prepare accordingly.
You can sign up to receive emails each time I publish.
Link to the original Bitcoin White Paper: White Paper:
Dollar-Cost-Average Bitcoin ($10 Free Bitcoin): DCA-SWAN
Access to our high-net-worth Bitcoin investor technical services is available now: cccCloud
“This content is intended solely for informational use. It is not a substitute for professional financial or legal counsel. We cannot guarantee the accuracy of the information, so we recommend consulting a qualified financial advisor before making any substantial financial commitments.