
Bitcoin Market Analysis: Mid-Cycle Correction or a Setup for the Next Leg Higher?
Bitcoin is currently trading at $81,270, down 25.5% from its all-time high (ATH) of $109,160, set on January 20, 2025.


Bitcoin is currently trading at $81,270, down 25.5% from its all-time high (ATH) of $109,160, set on January 20, 2025. The market is experiencing a significant retracement, with a 6% drop in the last 24 hours, a 13% decline over the past week, and a 16% correction in the last 30 days. This downturn has led to a shift in sentiment, reflected in the CBBI (Colin Talks Crypto Bitcoin Bull Run Index) dropping to 70, indicating we are still in a mid-cycle phase rather than near a final euphoric peak.
Despite this correction, the long-term fundamentals remain exceptionally strong. The institutional adoption wave continues, nation-state interest in Bitcoin is rising, and macroeconomic conditions suggest that Bitcoin could still reach $200K in 2025. The question remains: Is this just a shakeout before the next rally, or are we entering a deeper correction?
---
Technical Breakdown: Key Market Structures
Weekly Chart Analysis (1W Timeframe)
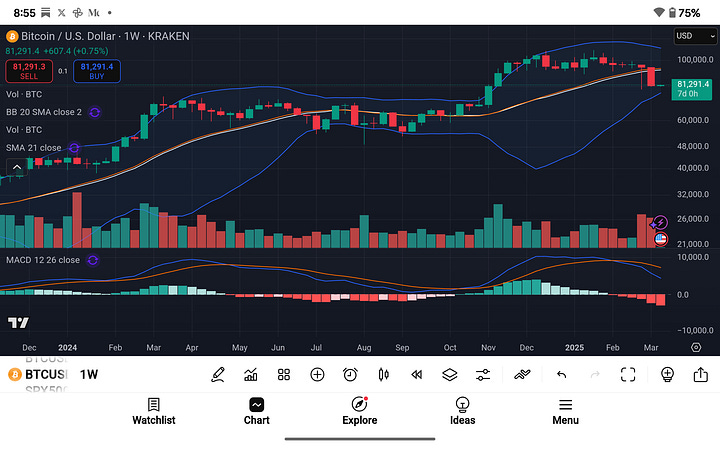
The weekly chart reflects a long-term uptrend structure, but Bitcoin is now testing key support levels.
Support and Resistance Zones
Key Support:
$78,000–$80,000: This region is being tested as a potential bottom following the sharp drop.
$68,000–$72,000: If Bitcoin fails to hold $80K, a deeper correction into this previous accumulation range is possible.
Key Resistance:
$85,000–$87,000: This is the first major level Bitcoin must reclaim to resume its bullish trajectory.
$100,000+: Once Bitcoin breaks back above six figures, it opens the door to price discovery toward $150K+.
Moving Averages & Trend Indicators
21-Week SMA (Bull Market Support Band): Bitcoin is currently testing this level, which has historically acted as a critical support zone during bull runs.
50-Week SMA: The next major support sits around $65K, aligning with historical correction levels.
Bollinger Bands: Bitcoin is testing the midline, suggesting a potential continuation downward if support doesn't hold.
MACD (Momentum Indicator)
The weekly MACD is rolling over, with histogram bars turning red, signaling a slowdown in bullish momentum.
If a bearish cross occurs, it could indicate further downside risk, unless buyers step in at these key levels.
---
Daily Chart Analysis (1D Timeframe)
The daily chart reveals short-term price action and key liquidity zones.
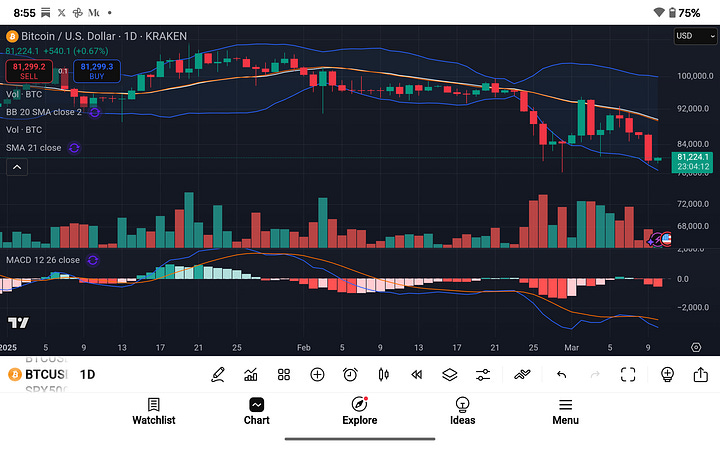
Short-Term Market Structure
Bitcoin briefly dipped below $80,000, but buyers aggressively defended the level.
The downtrend remains intact, with Bitcoin still below its 21-day SMA, meaning bulls need to reclaim this level to shift momentum.
MACD is attempting a bullish cross, suggesting that short-term relief could be near.
Key Levels to Watch
Support: $78,000–$80,000 (critical short-term demand zone)
Resistance: $85,000–$87,000 (must be reclaimed for a bullish reversal)
If Bitcoin fails to hold support at $80K, it may test $72K–$75K before forming a stronger base for the next leg higher.
---
Bitcoin vs. U.S. Dollar Index (DXY Correlation)
The U.S. Dollar Index (DXY) is currently at 103.6, down from recent highs of 107.
Historically, Bitcoin has an inverse correlation with DXY—when the dollar weakens, Bitcoin strengthens.
The recent pullback in DXY could provide a bullish catalyst for Bitcoin, especially if further downside in the dollar persists.
However, if DXY rebounds, Bitcoin may remain under pressure in the short term.
---
Fundamental Factors: The Path to $200K in 2025
Despite this correction, Bitcoin’s long-term bull cycle remains intact, supported by:
1. Institutional Demand & ETFs
Spot Bitcoin ETFs are seeing record inflows, with BlackRock, Fidelity, and other institutions accumulating BTC at a rapid pace.
Bitcoin ETF holdings now exceed 800,000 BTC, reducing circulating supply and increasing scarcity.
2. Nation-State Adoption
The U.S. government under President Trump has proposed a Bitcoin fund, signaling a major shift toward Bitcoin at the sovereign level.
Other countries are likely to follow suit, using Bitcoin as a strategic reserve asset.
3. Bitcoin Halving (April 2024)
The upcoming Bitcoin halving will cut new supply issuance by 50%, historically acting as a catalyst for parabolic price action in the following year.

Final Thoughts: Where Does Bitcoin Go Next?
Short-Term Outlook
Bitcoin needs to reclaim $85K to resume bullish momentum.
If $80K fails as support, the next likely area of liquidity is around $72K.
MACD on the daily is attempting a bullish cross, so we may see a relief bounce before further downside or continuation higher.
Long-Term Bullish Thesis
Bitcoin ETFs are driving institutional adoption at an unprecedented pace.
Nation-states are showing increasing interest in holding Bitcoin.
The upcoming halving will create a supply shock, historically leading to massive price surges.
Projected Path for 2025
Q2–Q3 2025: Bitcoin targets $120K–$150K, driven by institutional inflows and post-halving momentum.
Q4 2025: Bitcoin potentially reaches $200K, fueled by nation-state accumulation, institutional FOMO, and macroeconomic conditions.

Expanded Conclusion: Bitcoin’s Path to $200K and Beyond
Bitcoin is currently undergoing a technical correction, but the macro structure remains overwhelmingly bullish. This pullback, while significant, fits within the broader bull market cycle structure observed in previous post-halving phases. The confluence of institutional demand, ETF inflows, nation-state adoption, and supply-side constraints continues to build the case for a six-figure Bitcoin price target in 2025.
Key Technical Factors Supporting a Long-Term Bullish Outlook
1. Bitcoin’s Structural Market Cycles & Current Mid-Cycle Correction
Bitcoin has historically followed four-year cycles, heavily influenced by the halving events.
The 2020–2021 cycle saw a 54% mid-cycle correction before rallying to new highs — the current 25% drawdown remains well within historical norms.
The CBBI score of 70 suggests that we are not yet at a market peak, reinforcing the thesis that higher valuations are still ahead.
2. Key Levels to Watch for Reversal or Breakdown
$80K–$81K: This is a crucial support zone that, if maintained, could lead to a strong rebound.
$85K–$87K: A reclaim of this region would invalidate the bearish structure and signal a continuation of the uptrend.
$72K–$75K: If Bitcoin breaks below $80K, this range becomes the next major demand zone, aligning with the 50-week SMA.
If Bitcoin holds support at current levels and reclaims $85K, it could resume its climb toward new all-time highs in the coming months.
3. Momentum & Trend Indicators Aligning for a Stronger Move
MACD (Weekly & Daily Timeframes)
The weekly MACD is rolling over, indicating a slowdown in bullish momentum. However, a reversal near the zero line would confirm a trend continuation similar to previous bull cycles.
The daily MACD is attempting a bullish cross, suggesting that short-term relief could be near before resuming a stronger uptrend.
RSI (Relative Strength Index)
Weekly RSI remains in bullish territory, but cooling off from overbought conditions. This provides room for a renewed rally.
Daily RSI is oversold, which historically signals a potential bottom formation in bull markets.
Bollinger Bands
Bitcoin is testing the lower Bollinger Band on the weekly chart, indicating a strong area of potential support.
A reversion to the mean (20-week SMA) at $90K+ is highly probable in the coming weeks.

Institutional & Sovereign Adoption: The Ultimate Demand Driver
Beyond technical factors, fundamental adoption trends remain stronger than ever.
1. Spot Bitcoin ETFs Are Absorbing Supply at an Unprecedented Rate
ETFs like BlackRock, Fidelity, and Grayscale continue to accumulate Bitcoin, removing supply from circulation.
Total ETF holdings now exceed 800,000 BTC, representing over 4% of total circulating supply.
With daily ETF inflows surpassing newly mined supply, this supply shock dynamic is expected to accelerate price appreciation in 2025.
2. Nation-State Accumulation: A New Era of Sovereign Bitcoin Reserves
President Donald Trump’s recent announcement regarding a U.S. Bitcoin Fund could trigger a geopolitical wave of national adoption.
Countries such as El Salvador and Argentina have already embraced Bitcoin at a governmental level — if major economies follow, this could lead to a nation-state supply squeeze.
Central banks are beginning to recognize Bitcoin’s role as a strategic reserve asset, similar to gold accumulation in previous decades.
If sovereign entities begin accumulating Bitcoin in a significant way, it could create a demand-side imbalance that drives prices beyond $200K in 2025.
Macroeconomic Conditions Favoring Bitcoin as a Store of Value
U.S. Dollar Weakness & DXY Downtrend
The U.S. Dollar Index (DXY) is currently at 103.6, down from recent highs of 107.
Bitcoin has historically thrived in weak-dollar environments, as investors seek hard assets to hedge against fiat devaluation.
Global Liquidity Expansion
Central banks, despite short-term tightening, are expected to return to a more accommodative stance in 2025.
With global debt levels at all-time highs, governments may be forced to adopt inflationary policies — a long-term bullish tailwind for Bitcoin.
Projected Price Trajectory for 2025
Given the technical structure, institutional adoption, and macroeconomic alignment, the most probable price targets for Bitcoin in 2025 are:
Q2 2025: Bitcoin reclaims $100K, driven by ETF demand and post-halving momentum.
Q3 2025: Bitcoin enters a new price discovery phase, targeting $150K–$175K.
Q4 2025: If nation-state adoption accelerates, Bitcoin could surpass $200K, with potential upside to $250K in a full bull market extension.

Final Thoughts: Bitcoin’s Long-Term Trajectory Remains Unchanged
Despite short-term volatility, Bitcoin remains structurally bullish. The combination of ETF inflows, nation-state adoption, and macroeconomic shifts makes it highly probable that Bitcoin will surpass $200K in 2025.
Traders and investors should watch for a reclaim of $85K as a confirmation of renewed bullish momentum. If Bitcoin holds above $80K, it is well-positioned for a major breakout toward new all-time highs in the months ahead.
For long-term holders, accumulating Bitcoin during pullbacks has historically been the best strategy. With the halving event reducing new supply and demand-side pressures increasing, Bitcoin’s path to six-figure valuations remains intact.
The key takeaway? The bull market is far from over — Bitcoin is simply reloading for its next move higher.
You can sign up to receive emails each time I publish.
Link to the original Bitcoin White Paper: White Paper:
Dollar-Cost-Average Bitcoin ($10 Free Bitcoin): DCA-SWAN
Access to our high-net-worth Bitcoin investor technical services is available now: cccCloud
“This content is intended solely for informational use. It is not a substitute for professional financial or legal counsel. Accuracy of the information is not guaranteed; therefore, it is advisable to consult with a qualified financial advisor before making any substantial financial commitments.”