
Bitcoin Is Not Topping-It's Coiling
CBBI 75, MVRV Healthy, Miners Calm: Why the Data Says $200K Is Still in Play

Current Cycle Metrics: Holding Firm Below All-Time High
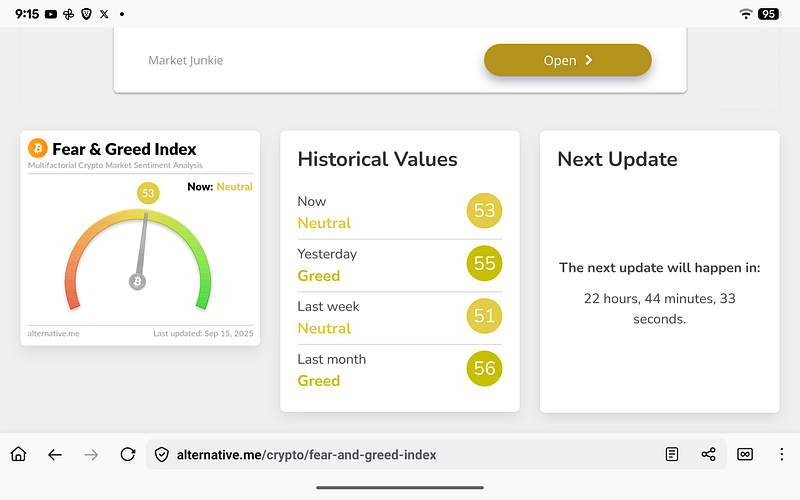
At the time of this report, Bitcoin is trading at $115,215, having pulled back 7.4% from its August 13th all-time high of $124,400. The CBBI Confidence Score sits at 75, suggesting we remain in the final third of the historical bull run model—but not yet at euphoria.
The Fear & Greed Index has recovered to 53, a neutral zone that aligns with the current consolidation period.
Macro Backdrop: DXY, M2, and Rate Liquidity
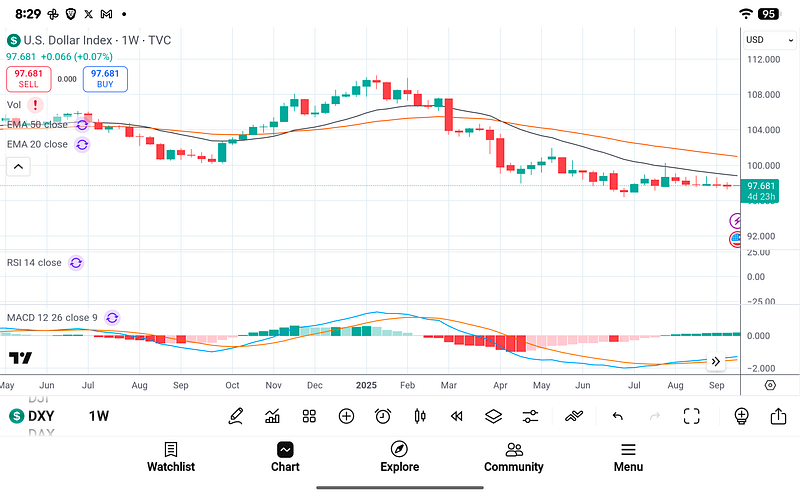
The macroeconomic picture remains supportive of further Bitcoin price appreciation. The U.S. Dollar Index (DXY) has formed a multi-month descending wedge and currently trades at 97.681. A bearish break here would represent a major tailwind for BTC-denominated assets.
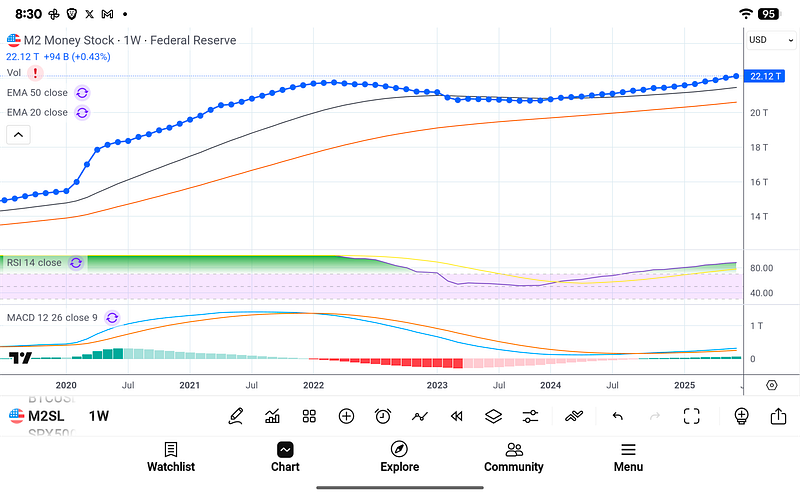
Money supply is also expanding again. M2 is now $22.12 trillion, with a weekly increase of $94.6 billion, suggesting liquidity is slowly returning—a condition historically correlated with upward pressure on Bitcoin price and asset markets generally.
On-Chain Conditions: Healthy, Not Overheated
Looking deeper into Bitcoin’s internal health, we find confirmation of strong but not overheated fundamentals:
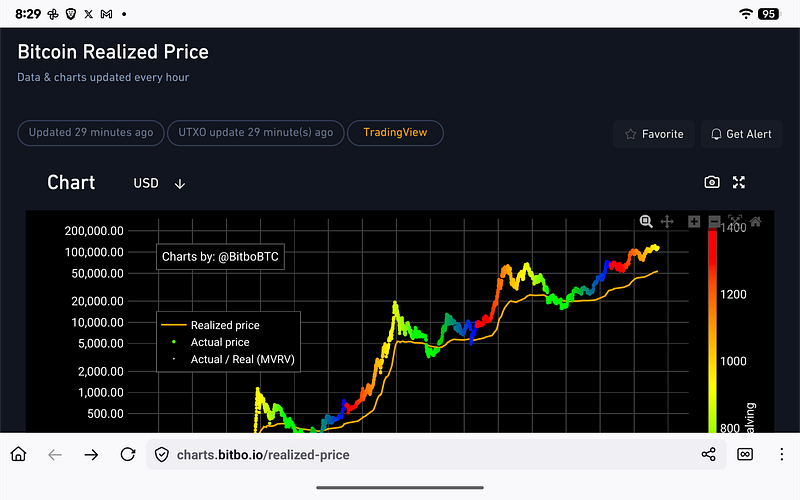
Realized Price (approx. $52,000) continues to rise slowly. Bitcoin’s market price remains elevated but not excessively detached from the chain-wide cost basis.
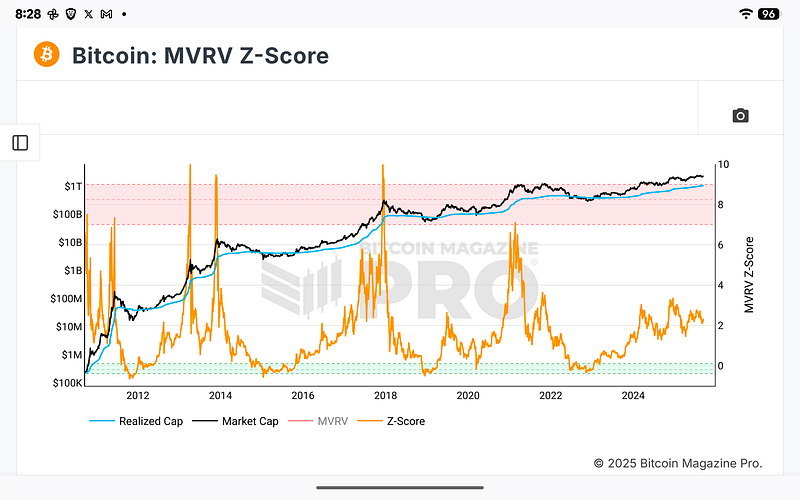
The MVRV Z-Score remains well below its danger zone. Historically, blow-off tops occur when this metric crosses into the red band (~Z > 7.0). We are currently closer to 2.5–3.0.
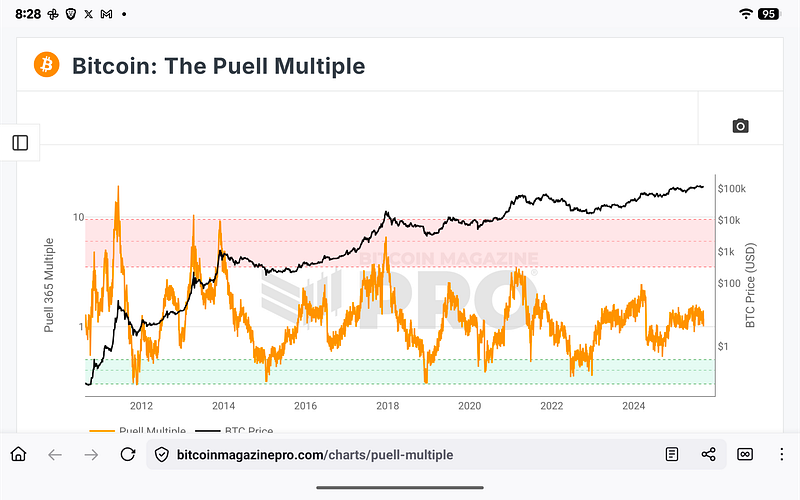
The Puell Multiple, a proxy for miner income relative to the historical average, also signals restraint. It sits below the red overheat zone, with miners not showing signs of capitulation or excessive profit-taking.
Protocol-Level View: What the Blockchain is Telling Us
The protocol itself shows expansion in usage but with discipline. The Lightning Network now holds 3,844 BTC in public capacity across 38,586 channels. There are now 26,277 reachable Bitcoin nodes, with 69.89% running over Tor—strong signs of decentralization and global node propagation.
OP_RETURN usage remains conservative at 0.1 GB, confirming the chain is not being spammed or overloaded with inscription bloat—a concern that triggered temporary congestion earlier in the year.

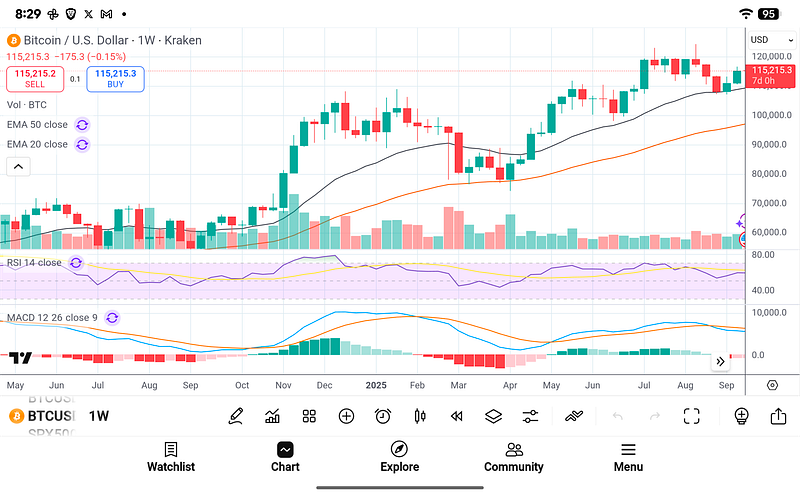
Price Structure: Still Consolidating After Reaccumulation
On the weekly chart, Bitcoin continues to consolidate above the $100K psychological level, holding its 20-week EMA and forming a likely base for another leg higher. RSI and MACD show renewed upward momentum without signs of divergence or exhaustion.
Structurally, this matches prior Appreciation to Acceleration transitions, particularly in the 2017 and 2021 cycles, where similar consolidation formed before a steep climb.
Historical Reference: This is Not the Top
In both 2017 and 2021, Bitcoin’s final 2–3 months before cycle peaks showed very specific signs:
MVRV Z-Score in Red Zone
CBBI above 90–95
Daily RSI exceeding 90
Fear & Greed peaking near 90–100
BTC Dominance rapidly rising
Weekly candles are closing far above their realized price.
Sudden exponential rise in mempool congestion and tx fees
None of these conditions are fully met today.
This moment more closely resembles late Q3 2017 or March 2021, when Bitcoin had already appreciated significantly but was not yet euphoric.

Expanded Outlook: Phase Model and $200K Projection
Using our proprietary Bitcoin Phase Model, which incorporates one-year volatility, profit bands, and the % of addresses in profit, we remain in a transition zone between Appreciation and Acceleration.
Volatility remains within the 1-year moving average range.
The top 90% of addresses are in profit, but not at the saturation levels seen at the top.
Acceleration begins when volatility compresses and then expands explosively—a compression we now observe.
If historical fractals hold, we should expect:
The resistance level of $130,000 to $140,000 is expected to be broken by November 2025.
The top formation and distribution are expected to be between $190K and $240K, unless there is a structural disruption by Christmas 2025.
Conclusion: Why This Isn’t the End—It’s the Set-Up
Every signal we track—from on-chain health to macro liquidity to miner behavior—tells us this cycle still has room to run:
The public remains underexposed.
Institutional interest continues to grow.
The UTXO set expands.
Corporate treasuries now hold 11.47% of supply—an all-time high.
There will be dips. There will be consolidation. But this is not the top. It is the moment of maximum asymmetry—a high-probability region between confidence and euphoria, right before things get loud.
If you’ve made it this far—congratulations. You’re early again.
You can sign up to receive emails each time I publish.
Here is the link to the original Bitcoin White Paper:
Dollar-Cost-Average Bitcoin ($10 Free Bitcoin): DCA-SWAN
Access to our high-net-worth Bitcoin investor technical services is available now:cccCloud
We solely intend this content for informational purposes. It is not a substitute for professional financial or legal counsel. We cannot guarantee the accuracy of the information, so we recommend consulting a qualified financial advisor before making any substantial financial commitments.