
Bitcoin in Ascent: Final Phase of the Bull Market Unfolds
A Deep Technical and On-Chain Breakdown of Bitcoin's 2025 Market Structure, Macro Tailwinds, and the Road to a Potential Cycle Peak

Bitcoin Market Analysis — May 19, 2025
Price: $106,400 | CBBI: 76 | Fear & Greed Index: 74
Bitcoin is trading just under its all-time high of $109,160, established earlier this year on January 20th. The market continues to show strength across technical, macroeconomic, and on-chain metrics. With the ColinTalksCrypto Bitcoin Bull Run Index reading 76, we are firmly in the final phase of the current bull market — though not yet at the euphoric peak historically marked by a CBBI reading above 90. Sentiment is elevated but still climbing. The Fear & Greed Index at 74 suggests enthusiasm, but not irrational exuberance. A final parabolic leg is building, and timing its apex will require close monitoring of on-chain activity, technical momentum, and broader liquidity flows.
Technical Structure: Price, Momentum, and Market Dynamics
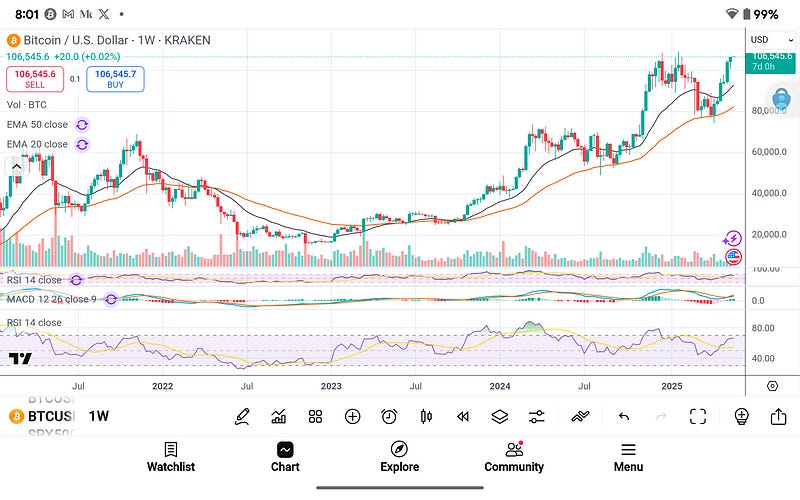
The weekly chart leaves no ambiguity: Bitcoin remains in a strong primary uptrend. Price has consistently printed higher highs and higher lows since the $25K breakout in early 2023. This uptrend accelerated after the 2024 halving, echoing the 2012 and 2016 cycle patterns where post-halving rallies took several months before entering exponential territory. The current structure suggests we are entering the same terminal phase.
The 20-week exponential moving average is sloped aggressively upward and currently holds as dynamic support around $94K. The 50-week EMA is trailing further below near $82K and continues to widen the gap, confirming bullish market structure. When the 20 EMA diverges upward from the 50 EMA in this manner, it typically precedes vertical acceleration — as seen in 2017 and again in Q4 2020. Weekly candle closes above the 20 EMA for over 30 consecutive weeks indicate strong trend persistence.
RSI on the weekly is hovering just above 70. While technically overbought, this level is a feature, not a bug, in Bitcoin bull markets. During the final stages of previous cycles, weekly RSI remained elevated for months, with readings above 85 before local or macro tops were registered. MACD on the weekly remains fully bullish, with expanding histogram bars and wide separation between signal lines. Importantly, there is no bearish divergence on either indicator.
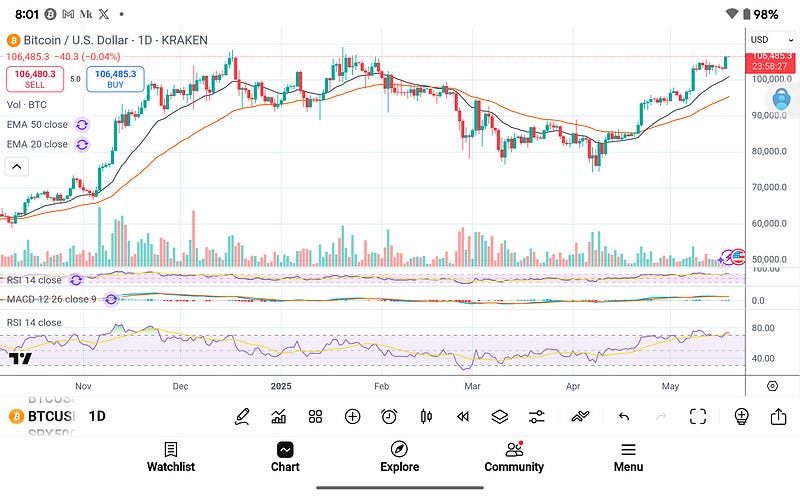
On the daily chart, Bitcoin has formed a broad ascending triangle structure with a horizontal resistance at $106K to $107K and higher lows dating back to late March. Price is coiling at resistance with tightening Bollinger Bands, implying a volatility expansion is imminent. Volume has declined slightly during this consolidation phase, which is typical of continuation patterns. Breakout confirmation will require a daily close above $107.5K with a spike in volume and RSI pushing beyond 75.
The daily MACD shows flattening signal lines with a neutral histogram, suggesting momentum is resetting rather than reversing. RSI remains strong, currently above 65, but not divergent. This supports the view that the market is pausing before continuation, not rolling over.
If price cleanly breaks above $110K, the next Fibonacci extension levels land between $123K and $137K. These align with historical projections based on market cap expansion during late-cycle dynamics, and they intersect with MVRV multiples and realized price extrapolations. Targets beyond $130K require both sentiment and volume to spike significantly, pointing to peak phase behavior.
On-Chain Signals: Realized Metrics and Miner Economics
The MVRV Z-Score is currently reading around 3.5. Historically, cycle tops coincide with MVRV Z values above 7.0, sometimes reaching above 9.0 during explosive blow-off phases. In 2013, the MVRV Z topped at 9.1. In 2017 it reached approximately 8.7, and in 2021 it peaked around 7.2. The metric combines market cap, realized cap, and standard deviation to identify extreme overvaluations. We are currently in the upper-middle band, signaling strong unrealized profits, but not yet excessive.
The realized cap has continued rising steadily, now tracking around $560 billion. Bitcoin’s realized price — an aggregate cost basis of all UTXOs — is approximately $30K. Current spot price is trading over 3.5x this baseline. In prior cycles, realized price ratios peaked around 4.5x to 6x. We are entering the upper territory, but the realized multiple supports the possibility of another 20–40% upside from current levels before a macro top is likely.
The Puell Multiple currently sits near 2.0. This metric tracks miner revenue over the 365-day moving average. Readings above 4.0 typically mark overheated conditions and precede sell pressure from miner capitulation. During the 2013 and 2017 peaks, the Puell Multiple surged to 7–10. We are far from that threshold. This suggests miners remain profitable but are not incentivized to mass liquidate. Miner selling is not a threat to price structure at this time.
Exchange reserves of BTC remain in persistent decline, and long-term holders show minimal distribution. Spent Output Profit Ratio (SOPR) is trending positive, meaning coins are being spent in profit, but not yet in the kind of profit-maximizing panic that precedes market tops. These metrics collectively imply conviction remains strong, and large holders have not yet begun to exit in bulk.
Macroeconomic Context: Liquidity, USD, and the Setup for Ascent
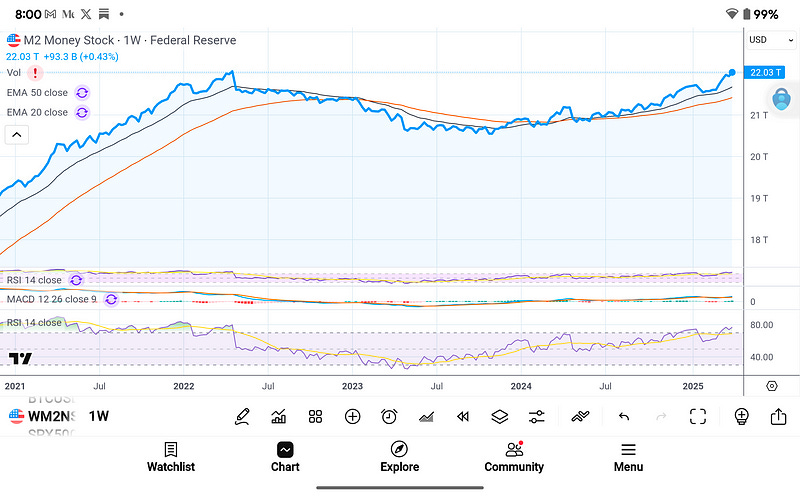
The macro backdrop continues to support the bullish thesis. M2 money supply in the United States has resumed its uptrend after a rare contraction in 2022–2023. The current figure stands at $22.03 trillion, up 0.43% in the past week alone. When M2 expands, liquidity conditions improve, and capital flows into scarce, risk-oriented assets like Bitcoin and equities. The last major M2 surge — post-COVID in 2020 — coincided directly with Bitcoin’s rally from $10K to $64K. We’re seeing early echoes of that cycle now.
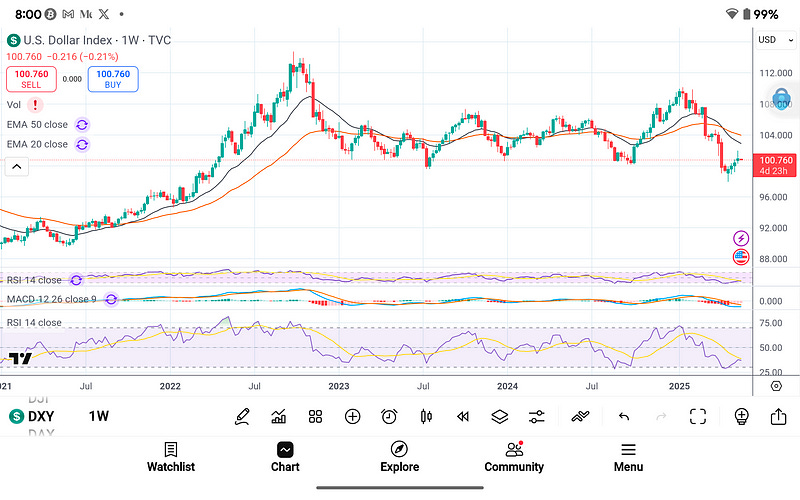
The U.S. Dollar Index (DXY) is hovering just under 101, after a failed bounce from 104. The breakdown from this support zone is notable. In all three previous Bitcoin bull markets, sharp DXY reversals to the downside directly preceded BTC accelerations. The 2020–2021 bull cycle occurred as DXY fell from 103 to 89. The current DXY trend suggests further weakening, which structurally supports a continuation of capital rotation into Bitcoin.
Real yields, while elevated, have plateaued. Should rate cuts occur in H2 2025 as forecasted by market consensus, Bitcoin will benefit from the same liquidity tailwind that propelled its previous cycle tops. This time, however, structural demand is stronger. ETFs, sovereign interest, and institutional custody are persistent new sources of demand that were absent in 2017 and nascent in 2021.
Cycle Status and 2025 Projections
With the CBBI at 76, the market has entered the terminal leg of the cycle. In previous cycles, this zone typically precedes the blow-off top by one to three months. In 2017, CBBI moved from 75 to 100 in 48 days. In 2021, the final run lasted just under 60 days. At current trajectory and sentiment velocity, Bitcoin could peak sometime between late June and early August 2025.
Upside targets remain anchored between $120K and $160K. The lower bound reflects a 4x multiple over realized price. The upper bound represents a full parabolic extension, similar to 2013 and 2017 when price overshot all major moving averages and technical targets by over 30%. Hitting $140K–$150K would push the MVRV Z above 6.5 and drive the Puell into the overheated zone — likely coinciding with RSI divergence and volume collapse, which are typical peak signals.
This structure could extend if macro conditions remain favorable and if the retail participation wave — which is currently moderate — expands aggressively in the coming weeks. Google Trends data, YouTube analytics, and mobile app downloads for Bitcoin wallets have not yet shown peak behavior. This leaves room for one last vertical phase driven by reflexive feedback loops.
Conclusion
Bitcoin remains in a structurally bullish phase, with confluence across technical charts, macro conditions, and on-chain fundamentals. We are late in the game, but the game is not over. The final run to the cycle top appears to be forming, with no major exhaustion signals yet. Momentum remains strong, miner behavior is sustainable, and capital flows are leaning into risk.
Traders should remain vigilant. The best trades are often in the late stages of a trend, but they come with risk. RSI divergence, sudden drops in volume, or extreme spikes in on-chain profit metrics will signal exit points. Until then, the market continues to favor upside continuation.
Cycle tops are not events — they’re processes. This one is unfolding right now.
Let me know if you want an update when CBBI hits 85 or if you’d like this packaged into a printable, professionally formatted report with chart overlays and projections.
You can sign up to receive emails each time I publish.
Link to the original Bitcoin White Paper: White Paper:
Dollar-Cost-Average Bitcoin ($10 Free Bitcoin): DCA-SWAN
Access to our high-net-worth Bitcoin investor technical services is available now: cccCloud
“This content is intended solely for informational use. It is not a substitute for professional financial or legal counsel. We cannot guarantee the accuracy of the information, so we recommend consulting a qualified financial advisor before making any substantial financial commitments.