
Bitcoin in Acceleration: Navigating the Final Ascent Before Euphoria
A comprehensive analysis of Bitcoin's 2025 cycle status, macro alignment, and on-chain signals as the market approaches critical thresholds


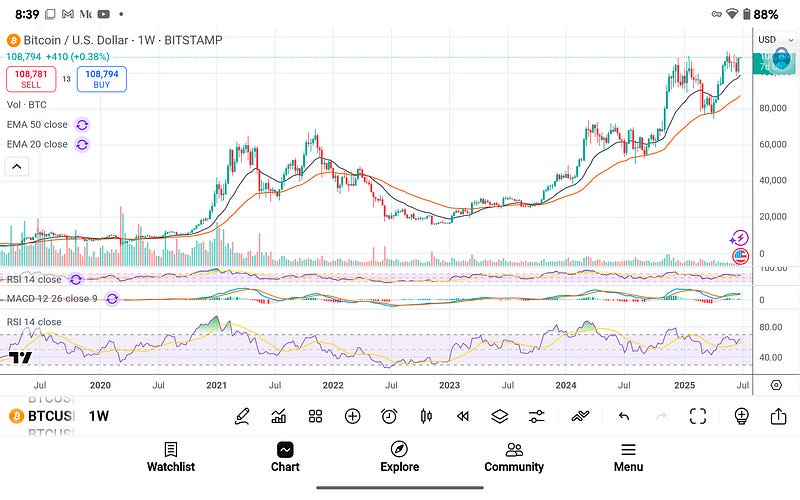
Bitcoin has decisively entered the late-stage bull cycle compression band. As of this writing, BTC trades near $108,800, structurally secure above its weekly 20 EMA ($93K) and accelerating away from its 50 EMA ($77K). The chart looks textbook bullish, with price consistently building atop rising support levels and volatility expanding in the direction of the trend. But while this phase invites optimism, history urges discipline. This stage is the Acceleration Phase—the period in every major cycle where price begins to outpace realized value, sentiment starts climbing into greed, and bullish narratives dominate airwaves. It’s powerful—but it’s not infinite.
Weekly Structure: A Clean Parabola in Formation
The weekly chart of BTC/USD is displaying a classic trend progression, characterized by rising lows, expanding highs, and steepening EMAs without any signs of curvature. The 20-week EMA has acted as launchpad support throughout this leg, and Bitcoin has not broken below it since reclaiming it in Q4 2023. Volatility compression between July and October 2024 resolved upward with a break of $75K, followed by a clean flag and breakout above $90K. Each leg since mirrors the behavior seen in the pre-euphoric 2017 and 2021 phases—sustained higher highs and shallow retracements.
Momentum indicators confirm this setup. Weekly RSI is now hovering just below 70—not overbought, but elevated. Historically, this region preceded vertical price discovery: in 2017, RSI stayed above 70 from August through December; in 2021, from October through April. MACD remains fully bullish, with no cross or histogram loss in sight. If momentum doesn't diverge or the RSI doesn't break above 90, we can expect a price range of $120K to $140K before late-cycle risk becomes significantly elevated.
Fear & Greed and CBBI: Thermal Conditions
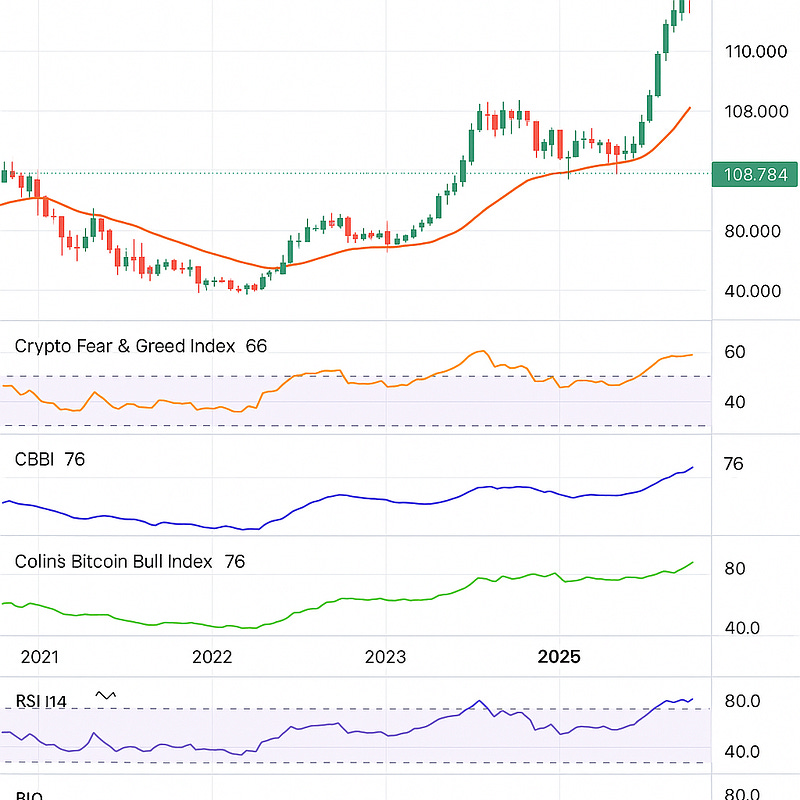
Sentiment has warmed but not overheated. The Crypto Fear & Greed Index sits at 66, a classic “early greed” zone. The ColinTalksCrypto Bitcoin Bull Run Index (CBBI) is now at 76—a critical number. In 2021, CBBI topped near 90 before BTC peaked at $64K. In 2017, it exceeded 85 just two weeks before the $20K high. These readings suggest we are not at the top but well past the midpoint. Importantly, CBBI readings in the mid-70s tend to precede high-velocity expansions, not tops. The market is not euphoric yet—but we are walking toward it.
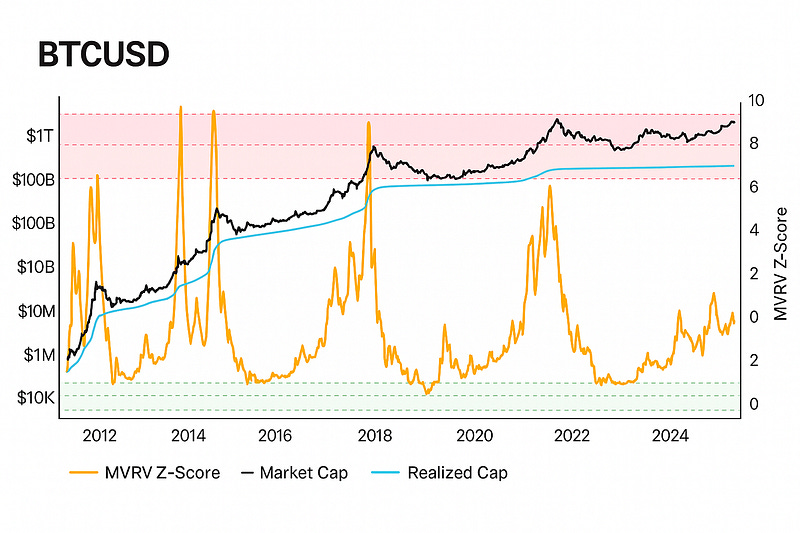
On-Chain Evidence: MVRV Z-Score and Puell in Check
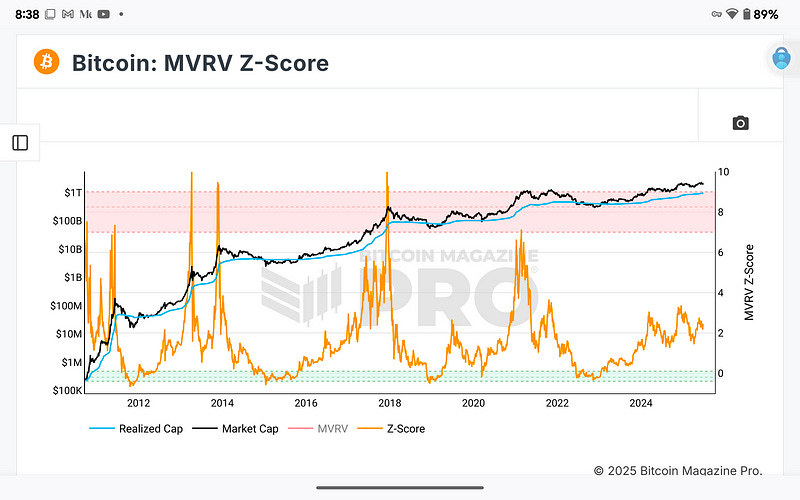
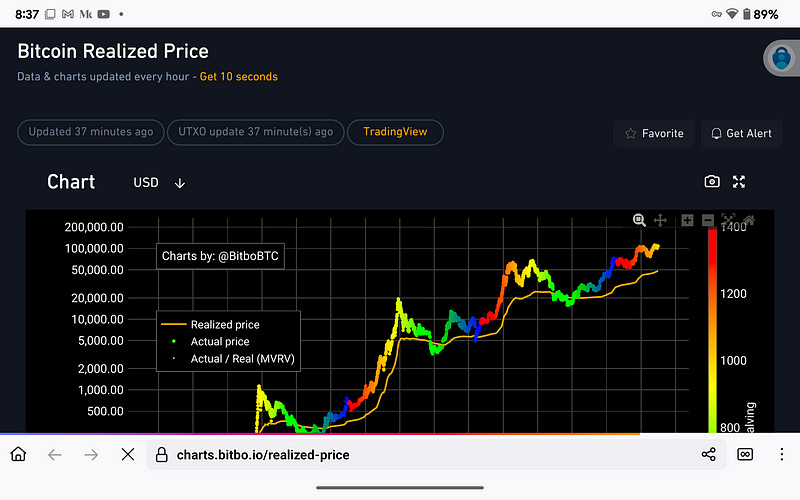
On-chain thermals are steady. The MVRV Z-Score, which historically signals tops above 7–9, is currently bouncing between 2.5 and 3.0. For reference, this score was already 5.2 by the time Bitcoin hit $60K in 2021 and over 6.5 at $17K in 2017. This context highlights that the current rally has more potential for growth, as the realized cap continues to increase steadily, suggesting broad market strength without excessive speculation.
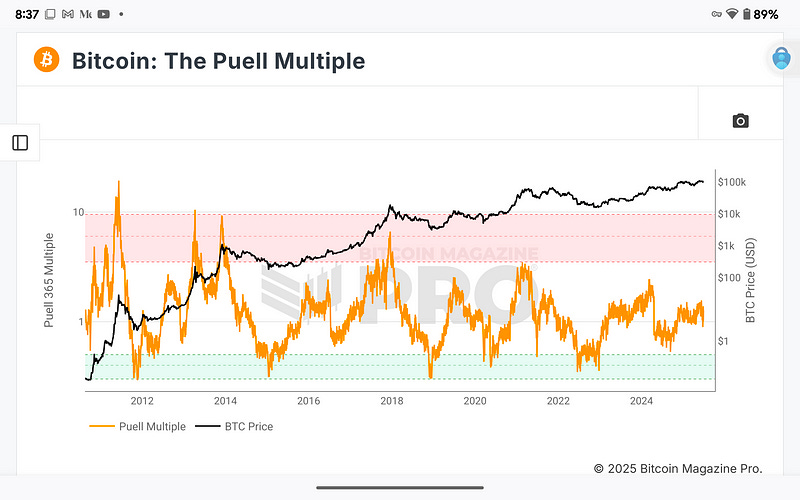
Similarly, the Puell Multiple, which measures miner revenue pressure, remains contained. Peaks above 4 tend to mark local or cycle tops; the current multiple is under 2, indicating that miner stress is not yet forcing large-scale distribution. In both 2013 and 2017, Bitcoin made its final vertical move only after the Puell metric rose rapidly into the danger zone; currently, we are not in that situation.
The Realized Price, now just under $39,000, adds further perspective. Price-to-realized ratios historically top between 3.5x and 4.2x; today, we sit just under 2.8x. Once again, the situation validates the thesis: we are at an elevated level, yet not overextended.
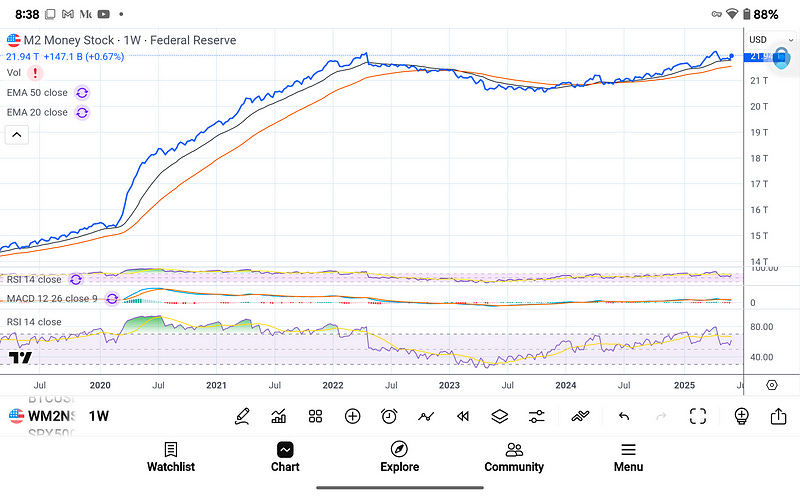
Macro: M2 Reflation and Dollar Reversal
This bull cycle is macro-aligned. M2 money supply, after stagnating and contracting post-2022, has resumed its climb. The last time this phenomenon occurred—March 2020 to April 2021—Bitcoin appreciated 1,400% from $5K to $65K. The macro tailwind is back.
Simultaneously, the DXY has collapsed below 98, breaking multi-year trendline support. The dollar peaked in late 2022 around 114; it now trades at the same level it held during BTC’s vertical moves in Q4 2020 and Q1 2021. A falling dollar is liquidity-positive for all risk assets, and Bitcoin—uncorrelated by design—has historically performed best during USD weakness. These macro conditions are ideal for Bitcoin’s late-stage expansion.
Historical Context: The Final Third
Zooming out, we are following historical rhythm almost perfectly. Post-halving cycles in 2013, 2017, and 2021 each followed a similar structure:
Year 0 (Halving Year): Recovery and early climb
Year +1 (Post-Halving): Acceleration and price discovery
Year +2 (Mid-year): Blow-off top and distribution
We are currently in Month 14 post-halving, the same temporal range where:
Bitcoin broke $1K → $20K in 2017
Bitcoin broke $20K → $64K in 2021
Cycle symmetry and structural mapping suggest that BTC could reach $135K–$155K before this expansion concludes. Timing-wise, Q4 2025 remains the most statistically probable window for a macro top, with on-chain indicators and liquidity conditions pointing toward September through November.
Forward Outlook: The Final Climb
If this Acceleration Phase plays out to historical proportions, we should expect:
A push to $120K–$130K over the next 6–8 weeks
A late-stage euphoria spike to $165K–$195K in Q4
One or more 20–30% drawdowns along the way, likely triggered by macro volatility, ETF saturation, or regulation headlines
The on-chain data, weekly structure, macro backdrop, and sentiment metrics all support this trajectory. However, investors must approach this phase with strategic flexibility. Returns are likely to compress while volatility expands. Positioning aggressively now is no longer about conviction—it’s about timing.
Final Notes
This phase is where most participants lose control—emotionally, tactically, and intellectually. Bitcoin rewards early discipline and late-stage clarity. As we press deeper into the parabolic zone, the priority shifts from entry to execution. This stage is no longer about whether Bitcoin is going higher. It's crucial to consider how you will handle the situation once the market ignites.
While the euphoria phase may still be two to three months away, it's important to recognize that the market has changed and we are already experiencing its surge.
Bitcoin remains unfinished. However, this phenomenon is closer to being over than most people are willing to acknowledge.
You can sign up to receive emails each time I publish.
Link to the original Bitcoin White Paper: White Paper:
Dollar-Cost-Average Bitcoin ($10 Free Bitcoin): DCA-SWAN
Access to our high-net-worth Bitcoin investor technical services is available now: cccCloud
“This content is intended solely for informational use. It is not a substitute for professional financial or legal counsel. We cannot guarantee the accuracy of the information, so we recommend consulting a qualified financial advisor before making any substantial financial commitments.